Creators Deserve to Know Their True Impact. Here's How to Prove It.
In 2026, the creators winning the best brand partnerships are not the ones with the most followers. They are the ones who can walk into a meeting and demonstrate with data that their audience takes action. The Impact Portfolio replaces screenshots of likes with metrics that prove behavioural change: save rates, share velocity, AI-analysed sentiment, and direct conversion data. Think of it as the influencer media kit rebuilt for a performance-first industry, the same document your brand contact will read, but filled with metrics that prove outcomes instead of listing audience sizes.
The Power Shift That Changes Everything
Something fundamental has changed in the relationship between creators and brands. For most of the past decade, a brand held all the leverage. It had the budget, the brief, and the ability to choose from thousands of competing creators. The creator had reach and audience and hoped the numbers were impressive enough to justify a line item.
In 2026, that dynamic has inverted. India's creators currently influence over USD 350 billion in consumer spending annually, a figure expected to surpass USD 1 trillion by 2030. Brands are not just spending more; they are demanding measurable accountability in return. And the creators who can provide that accountability, who can show, with precision, exactly what their audience does after a post have become genuinely scarce.
The 2026 Creator Economy Report identifies the rise of a Creator Middle Class: creators who have professionalised their platforms, built data infrastructure, and command partnerships based on proven performance rather than follower count. Independent individual creators dominate India's creator economy, holding an estimated 55.56% share in 2025, driven by affordable smartphones, cheap data, and social validation of content careers that have enabled a new generation of creators. The Impact Portfolio is the tool that gets a creator into that class.
Why the Old Media Kit No Longer Works
Most creators still send brands a media kit that lists follower count, average reach, engagement rate, and a grid of past brand logos. In 2025, 68% of creators undervalue their work while 72% of brands struggle to determine fair rates - a disconnect that costs both sides money and creates unnecessary tension in every negotiation [1].
The problem is not the document. It is what the document measures. Follower counts are the most manipulable metric in digital marketing. Average reach is a platform calculation that changes with every algorithm update. And an engagement rate built primarily on likes tells a brand nothing about whether a single person bought anything.
Creators who use formal rate cards and structured pricing documentation earn 23% more on average than those who negotiate case by case because they are referencing a professional standard rather than guessing in real time. The Impact Portfolio takes that principle further: it replaces the rate card's follower-count pricing with performance-evidence pricing. You are not asking for a rate. You are presenting proof.
In India specifically, the gap between creator value and creator compensation is particularly acute. Nano-influencers in Bhojpuri, Haryanvi, and Tulu dialects are routinely priced on follower-count rate cards built for an era when follower counts were the only metric anyone was tracking. In India, nano-influencer rates typically range from ₹5,000–₹15,000 per post, a figure that does not begin to account for the trust density, purchase intent, and community advocacy that regional language creators generate. The Impact Portfolio is how a Tulu creator in Mangaluru closes that gap with data.
The Five Impact Portfolio Metrics
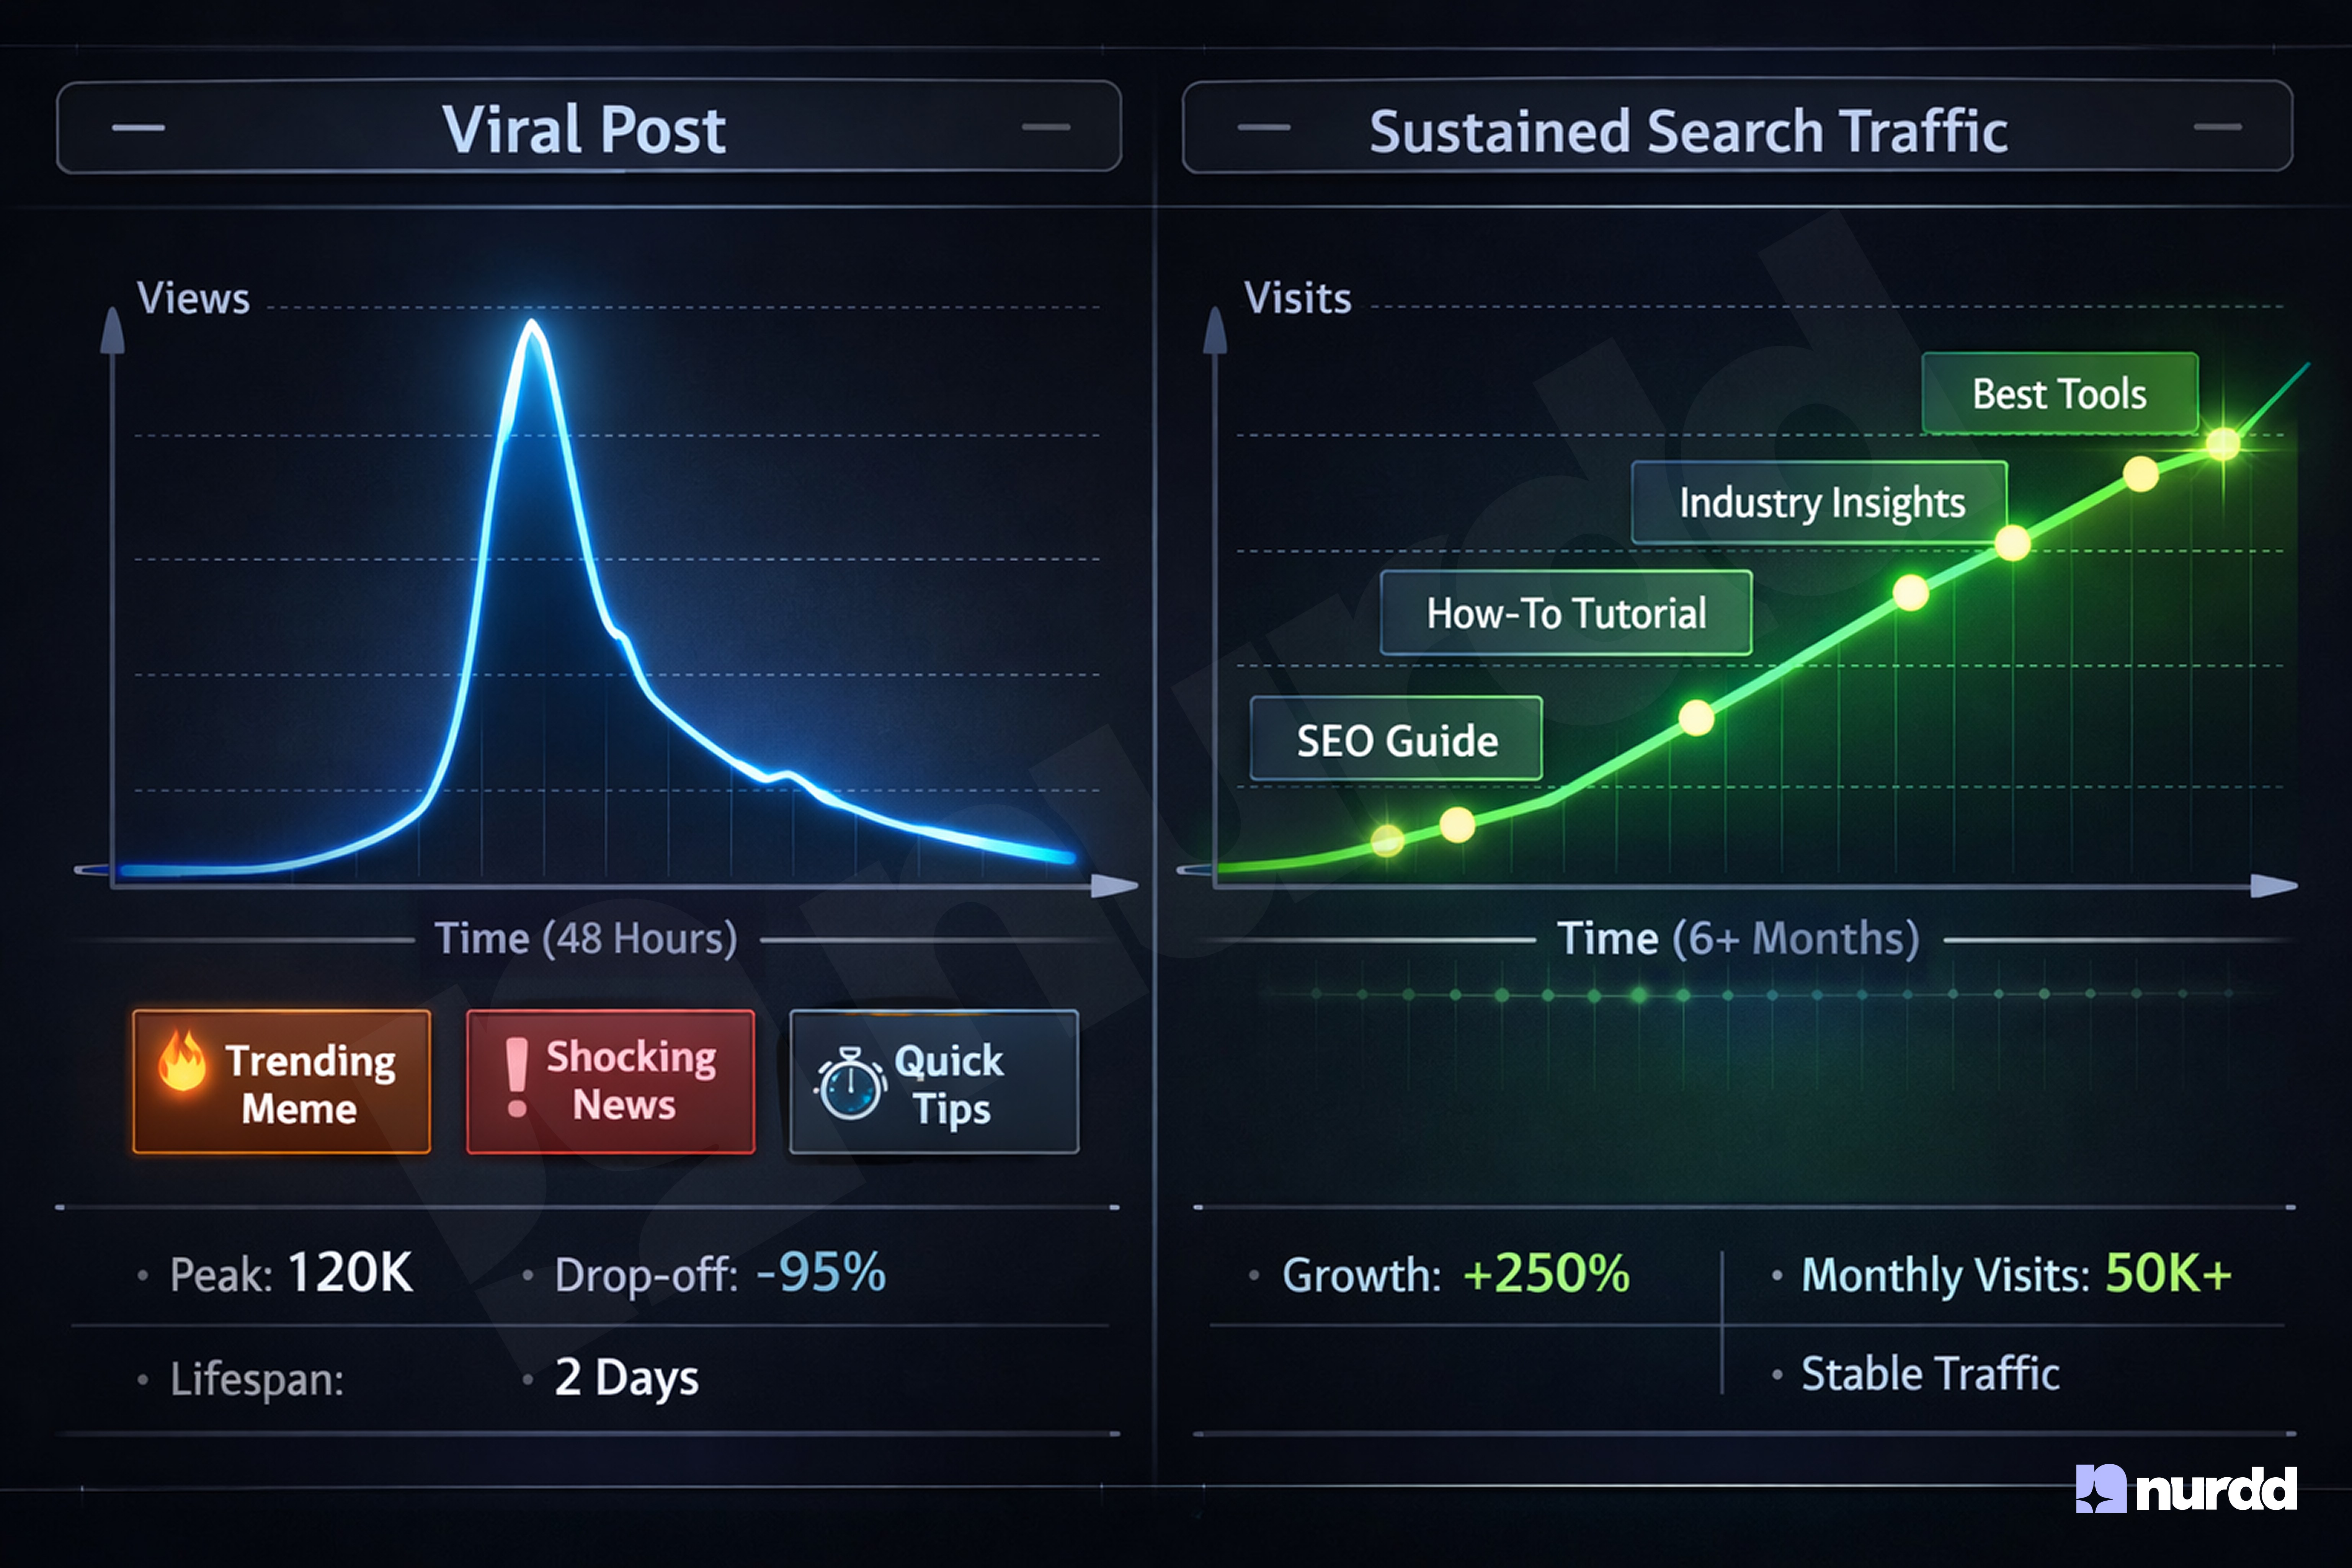
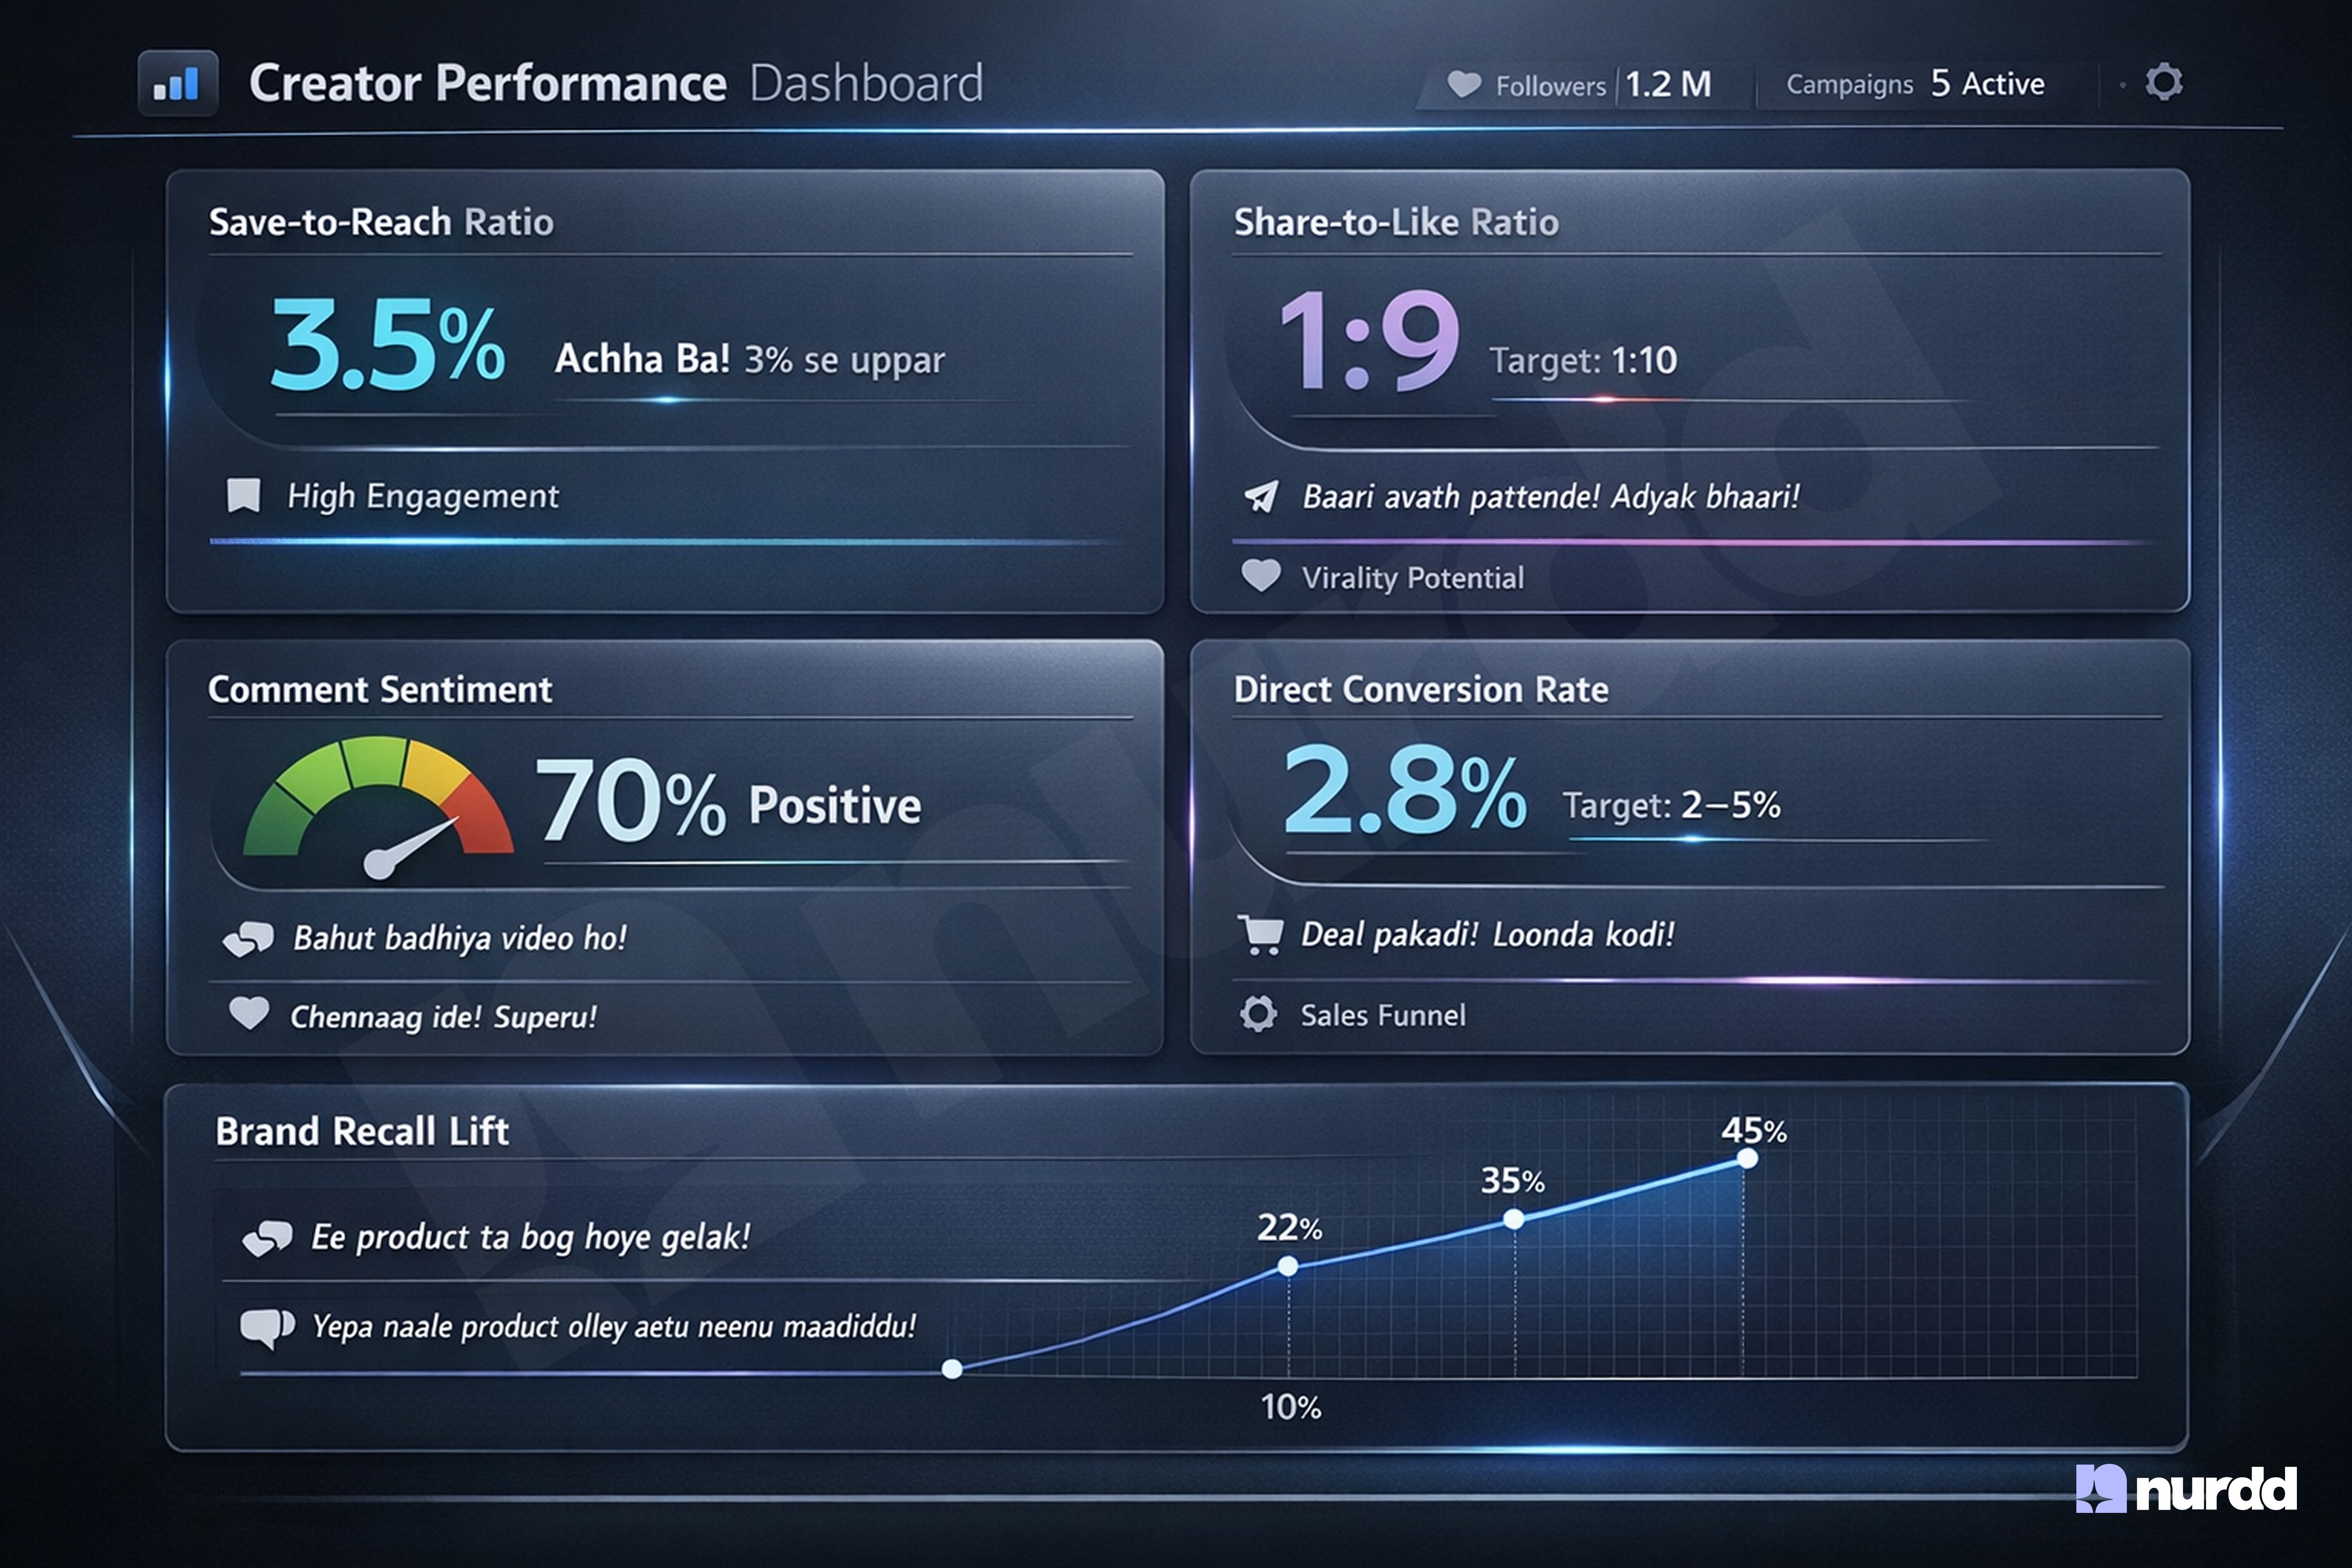
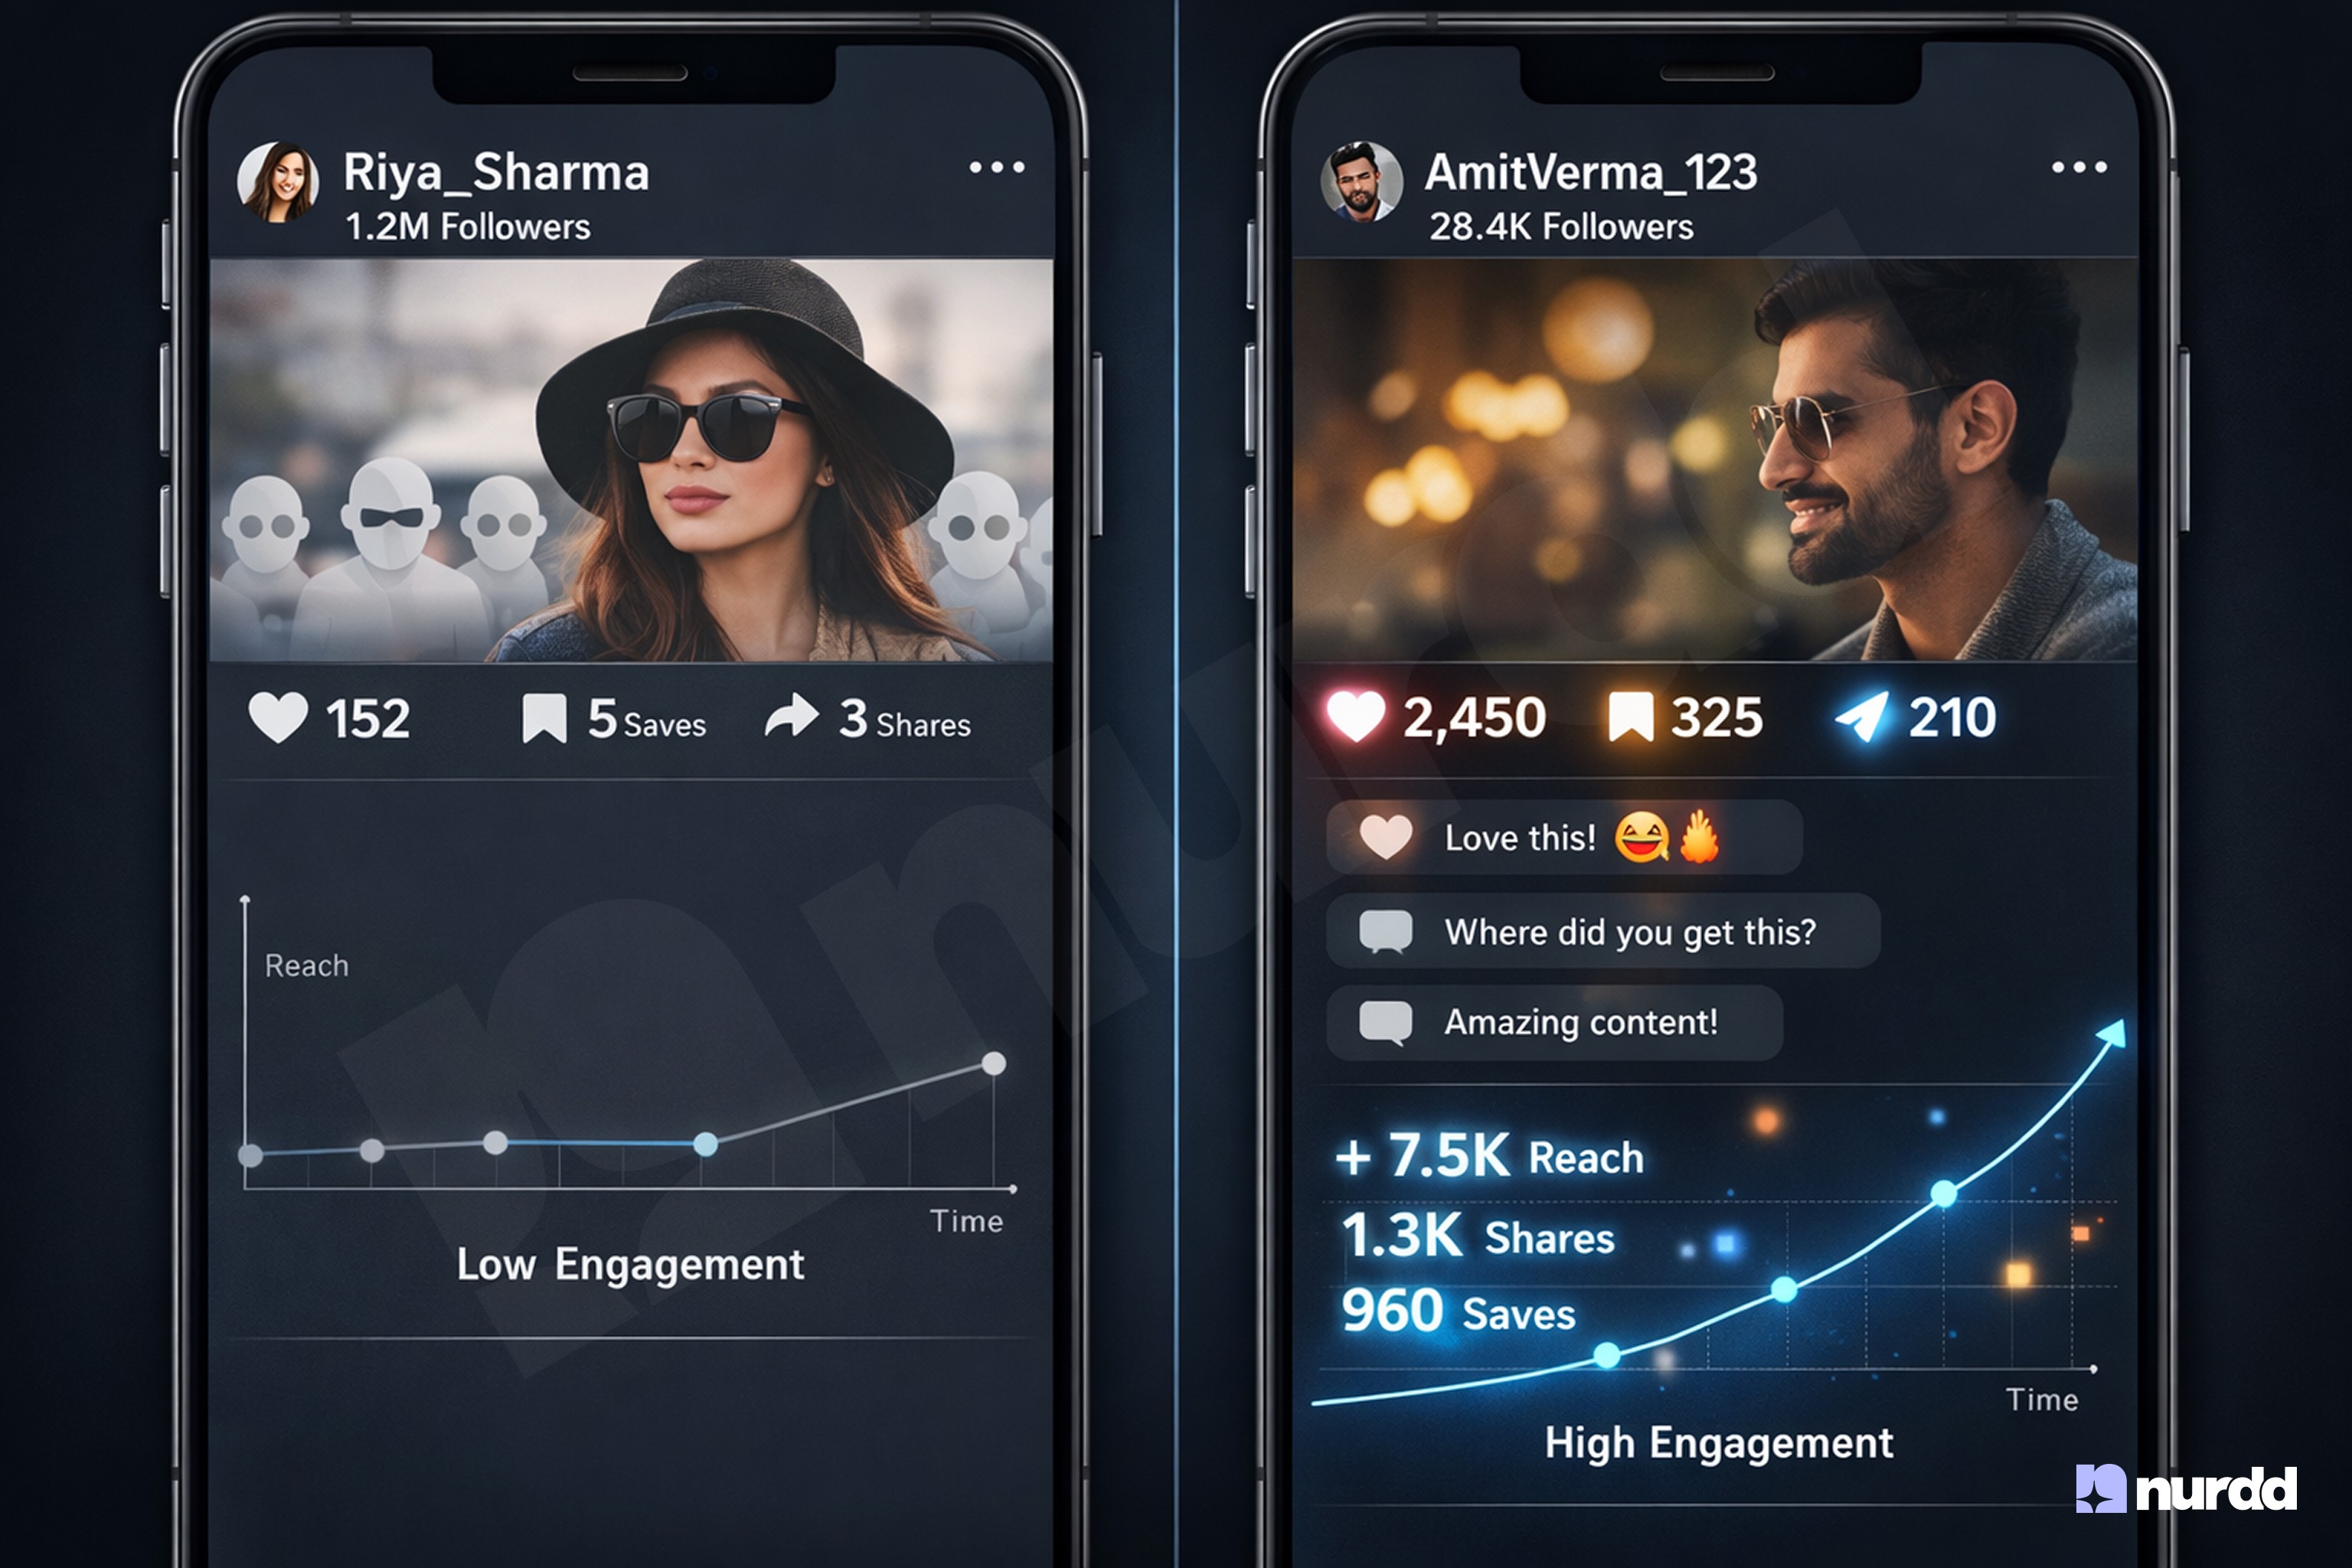
Save-to-Reach Ratio is the percentage of a post's total reach that saved the content. It is the clearest available signal of purchase intent short of an actual conversion because people save content they plan to act on, revisit, or share with someone who will buy. A high save rate means your audience is treating your content as a reference, not entertainment. The 2026 benchmark for high-intent content is a save-to-reach ratio above 3%. A creator who consistently achieves 4–5% on product posts is demonstrating, without a single click, that their recommendations carry purchasing weight.
Share-to-Like Ratio is the number of shares divided by the number of likes - the single clearest measure of virality and advocacy in a creator's content. Likes are passive acknowledgement. Shares are active endorsements: the moment a follower forwards a post to someone in their network, they are putting their personal credibility behind it. A nano-influencer in a specific niche with super high engagement, followers who actually interact with content consistently delivers better conversion rates than mega celebrities with passive audiences. The share-to-like ratio is the metric that quantifies that interaction premium. The 2026 benchmark is 1 share for every 10 likes. Consistently above it means your content is a distribution engine.
AI-Analysed Comment Sentiment is the percentage of comments that express positive or genuinely inquisitive intent, as measured by natural language processing. The distinction is not subtle: a comment that says "gorgeous 😍" is not the same as one that says "does this work on oily skin?" or "where do I find this in Mangaluru?" The latter represents active purchase consideration. For creators producing vernacular content in Bhojpuri, Tulu, or Haryanvi where AI sentiment tools can now process regional dialects, this metric separates authentic community engagement from the shallow engagement pods generate. The benchmark is 70% positive or inquisitive sentiment.
Direct Conversion Rate is the percentage of a creator's audience that completes a purchase or sign-up through an affiliate link or trackable promo code. It varies by category 2–5% is the operative range for D2C product categories in India — but its value lies less in the absolute figure than in the trend. A creator whose conversion rate increases campaign over campaign, across multiple brands, is demonstrating that their recommendations are trusted enough to drive consistent purchase behaviour. Influencer compensation is shifting from simple per-post fees toward performance-based models that tie payment to actual results — and a conversion rate trend line is precisely the data those models are built on.
Brand Recall Lift is the percentage increase in brand recognition among a creator's audience seven days after a campaign post, measured through platform polls or close-friends story surveys. It is the Impact Portfolio's long-term memory metric proof that the creator's content creates lasting brand association, not just a momentary scroll-stop. A creator who can show a consistent 20–30% recall lift across multiple brand collaborations is demonstrating middle-funnel value that no performance dashboard can produce on its own.
The 2026 Toolkit: How Creators Verify Every Metric
Metrics alone are not enough. These three methods are how sophisticated creators turn their Impact Portfolio data into verified, brand-level proof that cannot be argued with.
Method 1: The Clean Room Collaboration is the most technically advanced proof method available and the one that most dramatically re-prices a creator's value. Data Clean Rooms offered through Amazon Marketing Cloud and Google Ads Data Hub allow a creator and a brand to match their respective audience datasets without either party sharing personally identifiable information. The output is an exact count of how many of the creator's followers became new customers during the campaign window. No attribution modelling. No inference. Direct overlap, verified at the data layer. A creator who arrives at a negotiation with a clean room analysis from a previous partnership with a comparable brand is not presenting a media kit. They are presenting a proof of performance that most creators cannot produce.
Method 2: Post-Purchase Attribution Surveys are the creator's tool for capturing dark social impact, the purchases made because of their content but not tracked through any link. When a follower sees a Reel, discusses it with a friend, and that friend buys the product three days later, the sale appears in the brand's dashboard as direct traffic. The creator receives no attribution credit. The fix is operationally simple: creators now ask brands, as a standard condition of collaboration, to include their name or channel as a named option in the post-checkout "how did you hear about us?" survey. When 35–40% of surveyed customers name a specific creator, that attribution data immediately re-prices the creator's contribution to the campaign and makes the case for a higher rate on every future collaboration.
Method 3: Predictive Performance Vetting is the practice of presenting a brand with a projected ROI report before the campaign begins, based on the creator's last five comparable collaborations. Tools like HypeAuditor and Modash generate these reports showing expected engagement quality, estimated conversion range, audience authenticity scores, and predicted reach for a given content format. A creator who walks into a brief meeting with a predictive report is not a vendor accepting terms. They are a partner proposing an outcome. Having actual data on both sides creates transparency and a more equal relationship between creators and brands so both can make the right decision.
What This Means for Indian Creators Specifically
Brand sponsorships and influencer partnerships remain the most lucrative monetisation route for Indian creators, holding an estimated 31.4% share of creator revenue in 2025 growing into long-term brand ambassadorships, data-driven campaigns, and co-created content. But the pricing infrastructure has not kept pace with performance reality.
A D2C skincare startup with a modest budget working with 15 nano-influencers achieved an 8.2% engagement rate against a 3–4% benchmark, 340 purchases, and a 2.4x ROI [2]. Most of those creators were paid on a rate card that reflected their follower count not their actual business impact. The Impact Portfolio is how they would have been paid on the latter.
The most powerful sentence a creator can say to a brand in 2026 is not "I have 85,000 followers." It is: "My last five campaigns generated an average 4.1% save rate, a 74% positive sentiment score, and were named by 38% of post-purchase survey respondents as their first touchpoint with the brand."
That sentence is not a pitch. It is evidence. And evidence, not audience size, is what commands a rate in a performance-first industry.
Sources
InfluenceFlow — Influencer Rate Cards and Pricing Tools: The Complete 2026 Guide (Dec 2025): influenceflow.io
InfluenceFlow — Influencer Case Studies and Success Metrics: Real Results That Prove ROI in 2026: influenceflow.io
Coherent Market Insights — India Creator Economy Market Analysis and Forecast: 2025–2032: coherentmarketinsights.com
Influencer Marketing Hub — Nano Influencer Rates: A Complete Cost Guide for Brands in 2026 (Dec 2025): influencermarketinghub.com
JigsawKraft — Influencer Marketing Cost in India: Complete 2026 Pricing Guide (Feb 2026): jigsawkraft.com
InfluenceFlow — Using Influencer Rate Cards and Benchmarks: A Complete 2026 Guide (Dec 2025): influenceflow.io
Shopify India — Influencer Pricing: The Cost of Influencers in 2026: shopify.com/in
Impact.com — Influencer Marketing Trends 2026: Performance Insights (Jan 2026): impact.com
Business of Fashion — The Metrics That Matter in Today's Creator Economy (Feb 2026): businessoffashion.com
Kofluence — Decoding Influence: 2025 India Influencer Marketing Report (Aug 2025): kofluence.com