Why Your Google Ads ROAS Is Lying to You (And What the Real Number Looks Like)
 4 Aug 20267 min read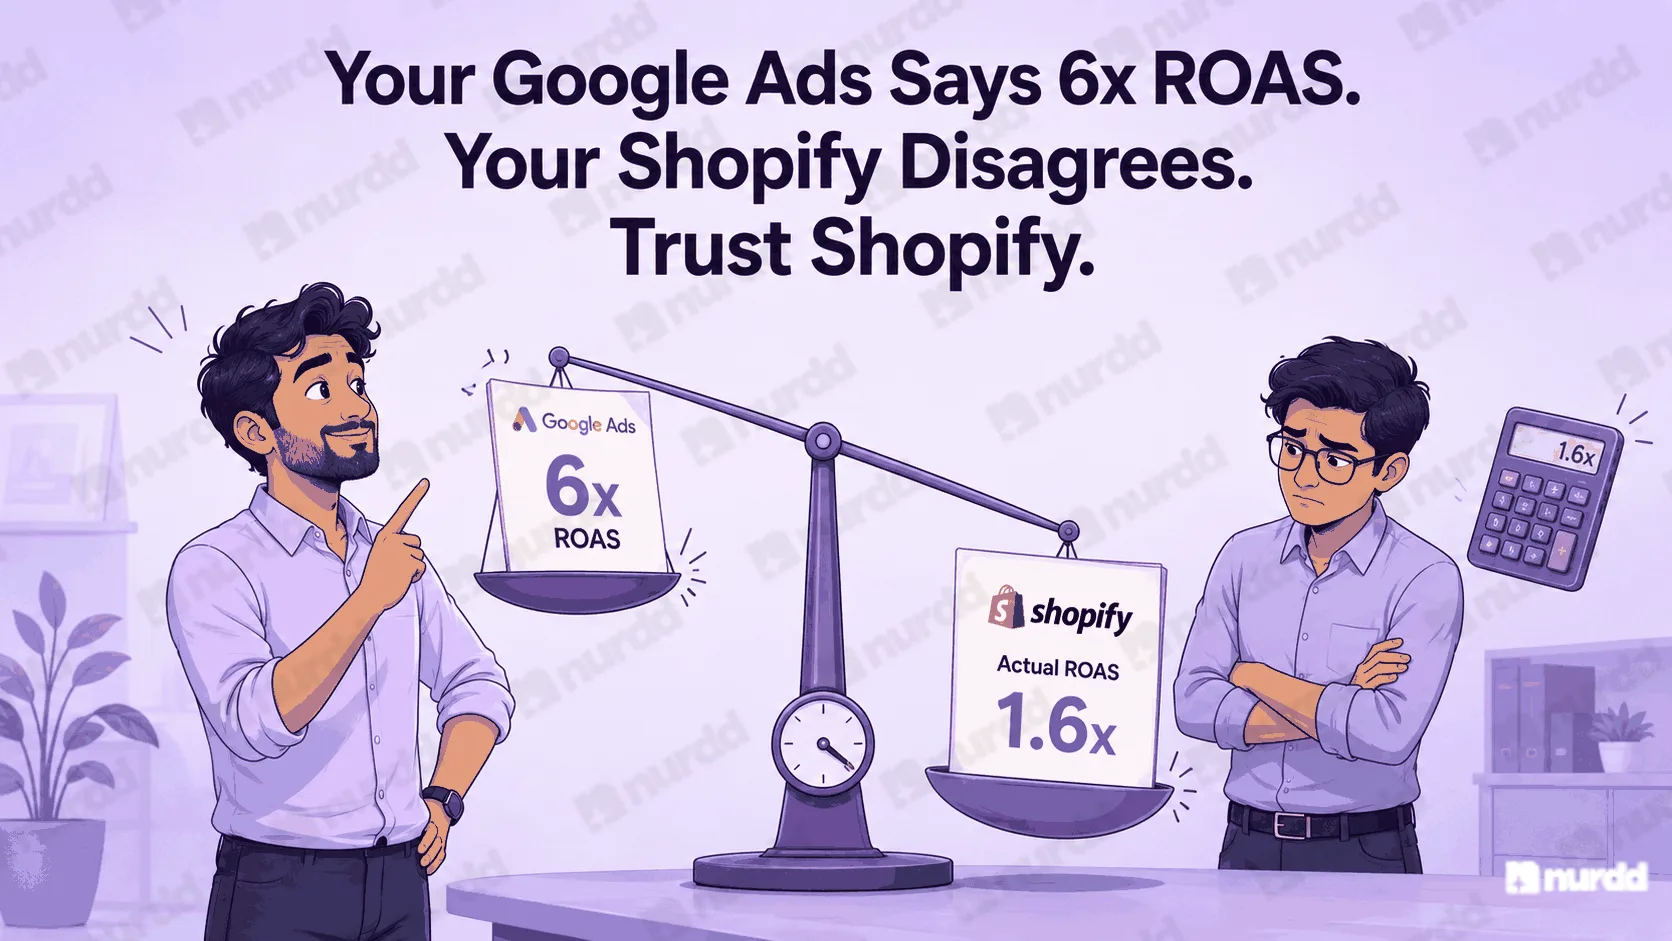
Your Google Ads dashboard shows a 6x ROAS. Your Shopify revenue report tells a different story. Your finance team is asking why the marketing spend is not reflecting in the actual bank balance. You are not imagining the discrepancy. Google Ads is not lying to you on purpose but it is counting things in a way that makes your campaigns look significantly better than they actually are.

The Three Reasons Your Google Ads ROAS Is Inflated
Attribution Window Overlap
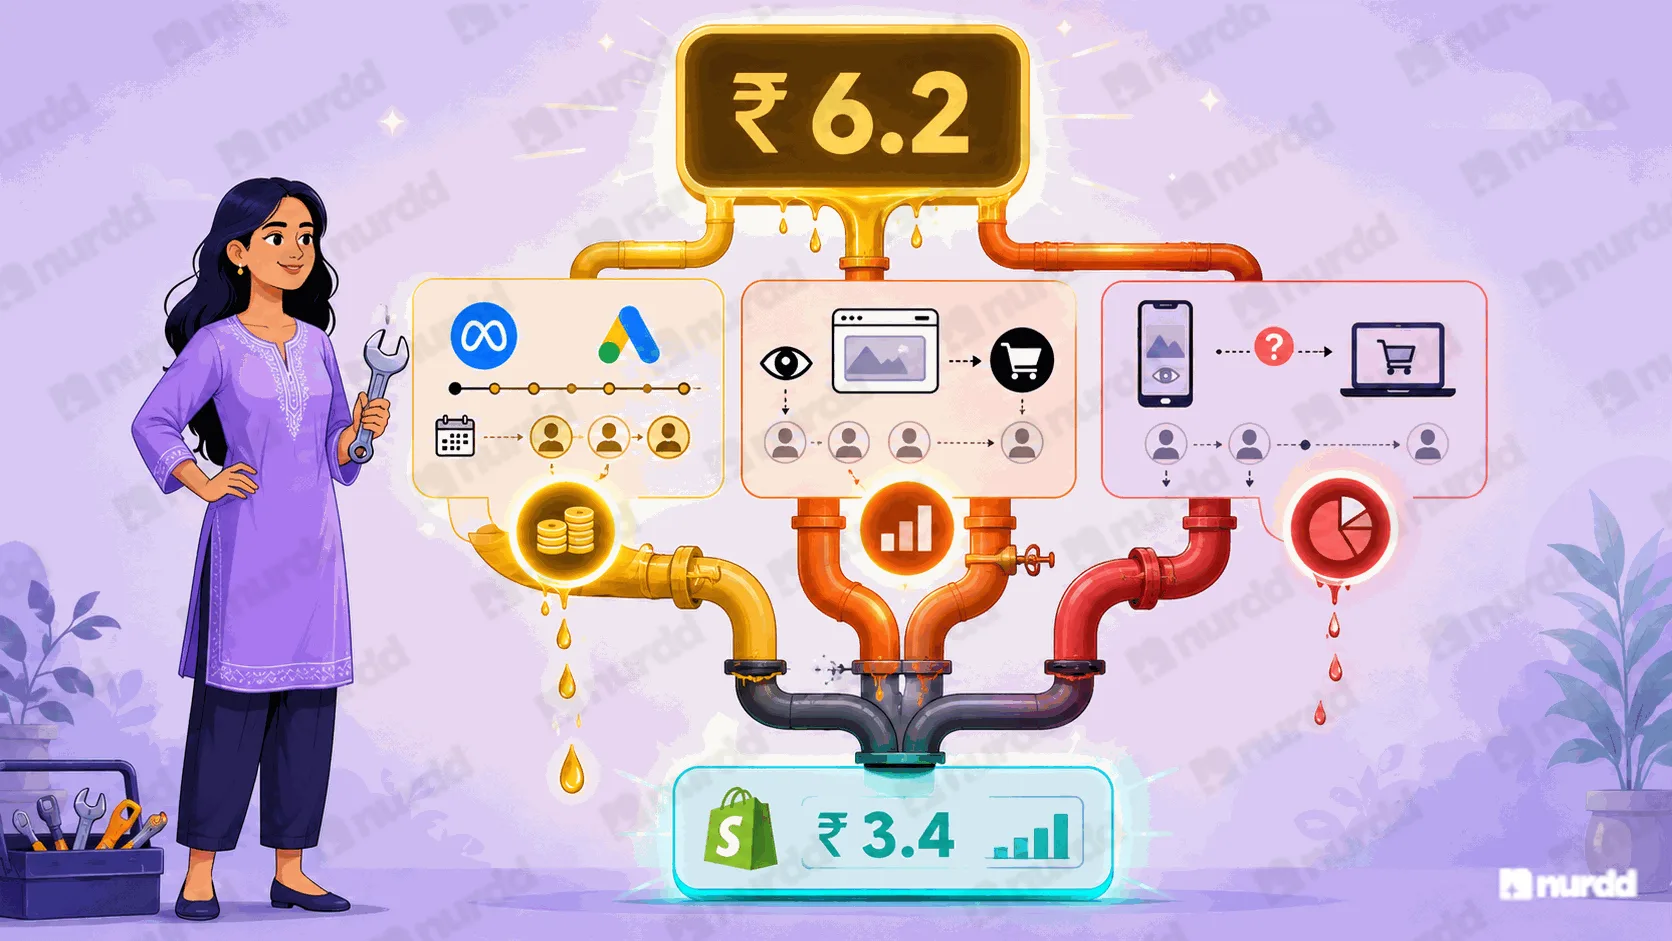
Google Ads, by default, uses a 30-day click attribution window. This means that if a customer clicks your ad and then buys anything on your website within the next 30 days even if they came back through a direct visit, a Google organic search, or an email 25 days later Google Ads claims credit for that purchase. If you are also running Meta campaigns, Meta is likely claiming credit for the same purchase. The revenue gets counted twice. Your blended return is lower than either platform reports.
View-Through Conversions
Google Ads can count a conversion if someone saw your display or YouTube ad even if they never clicked it and then made a purchase within 24 hours. For most D2C campaigns, view-through conversions inflate reported ROAS by 15 to 40 percent depending on how much display and video spend is in the mix. Check your attribution settings to see if this is switched on.
Cross-Device Attribution Gaps
A customer sees your Shopping ad on their phone, does not click, searches for your brand name on their laptop two hours later, and purchases. Google's cross-device attribution may or may not connect these events depending on whether the customer is logged into Google on both devices. When it does connect them, it assigns credit to the original phone impression. When it does not, the purchase shows as direct traffic in your analytics with no ad attribution at all.
How to Calculate Your Real ROAS
The most reliable approach is to use your Shopify or WooCommerce revenue data as the source of truth, not your ad platform dashboard. Total revenue attributed to paid channels divided by total ad spend equals your blended ROAS and this number, while lower than your platform-reported ROAS, is the one that reflects reality.
For a more granular view, run a simple incrementality test. Pause Google Ads for a specific campaign for one week and measure the change in total revenue. If your Shopping campaign is reporting a 5x ROAS but pausing it reduces total revenue by only 15 percent of the claimed amount, the real contribution is smaller than the reported number suggests.
The Attribution Settings to Change Today
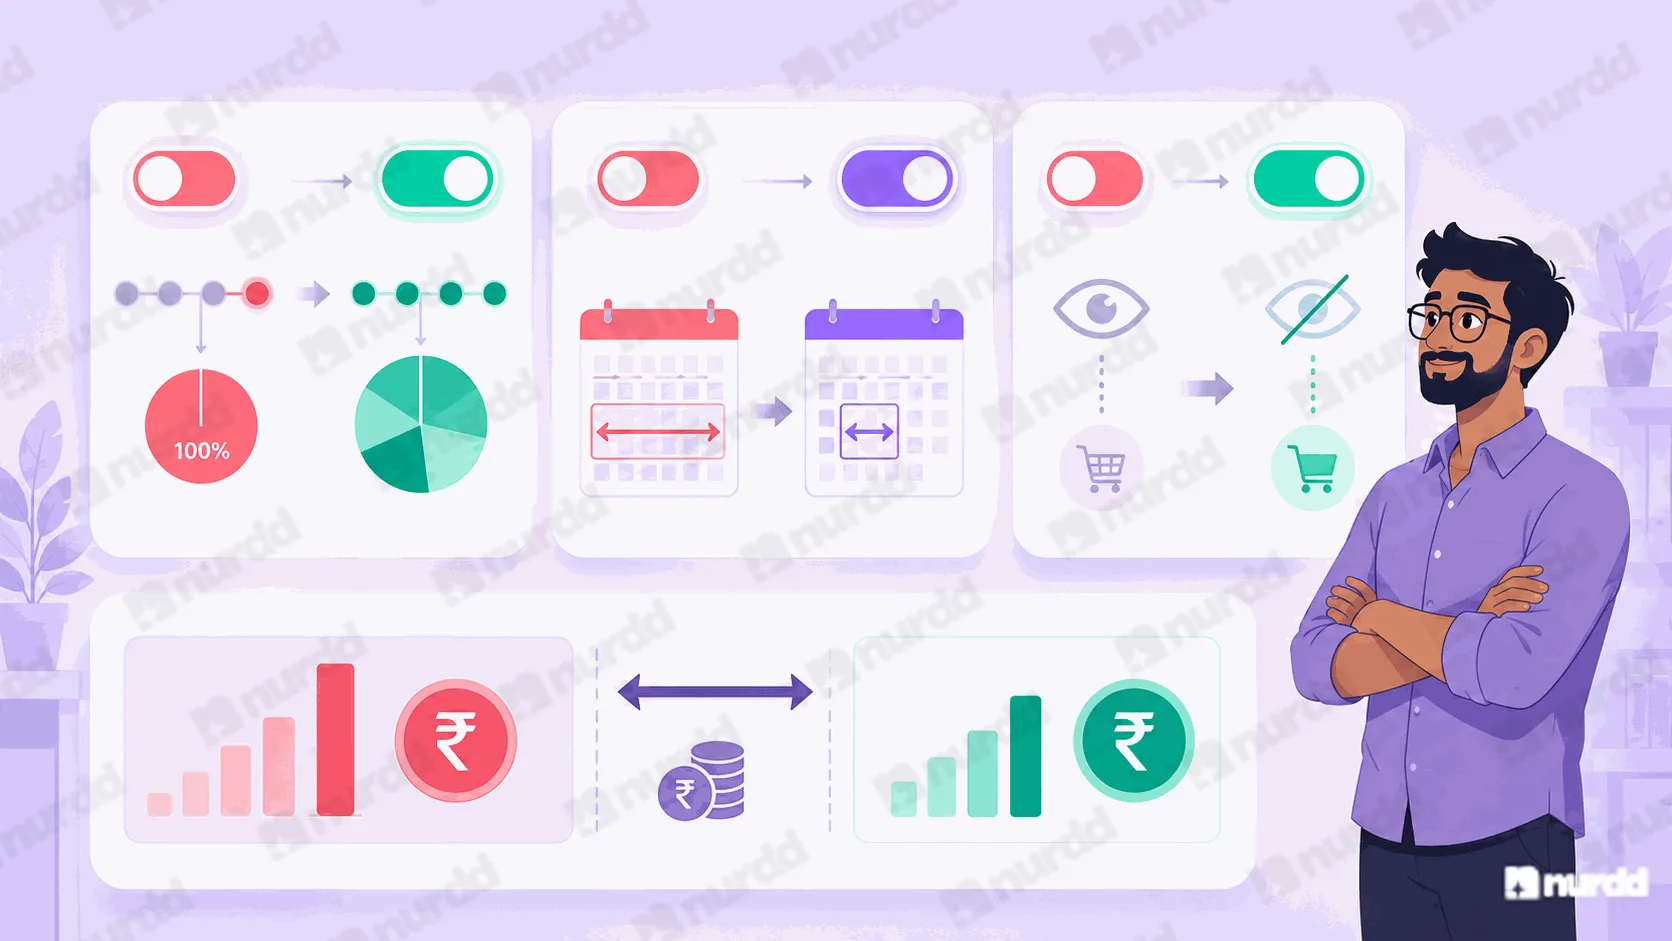
Switch from last-click to data-driven attribution in your Google Ads account. Data-driven attribution distributes credit across the full customer journey rather than giving 100% credit to the last click, which produces a more honest picture of each campaign's contribution.
Reduce your click attribution window from 30 days to 7 days for most campaigns. For high-consideration products furniture, jewellery, high-end supplements 14 days may be appropriate. For impulse or low-consideration products, 3 to 7 days is more accurate.
Turn off view-through conversions unless you are running a brand awareness campaign where impression credit is genuinely appropriate. For conversion campaigns, view-through conversions almost always inflate ROAS without reflecting genuine performance.
How Pulse Helps
Pulse shows your Google Ads performance with Shopify revenue as the cross-referenced source of truth. Instead of trusting the platform-reported ROAS, Pulse maps ad clicks to purchase events in your store giving you the actual revenue number per campaign, per ad group, and per keyword.
"The ROAS in your dashboard is the story Google Ads tells about itself. The revenue in your Shopify is the truth. When those two numbers disagree, always trust Shopify."
Sources & References
Google Ads Help (2025) – Attribution Models and Conversion Windows | support.google.com/google-ads
Northbeam (2025) – Cross-Platform Attribution Accuracy Report | northbeam.io/blog
Triple Whale (2025) – ROAS Discrepancy Analysis: Platform vs Reality | triplewhale.com/blog
Pulse, Nurdd (2026) – Google Ads Attribution Accuracy: Indian D2C Data | nurdd.club/blogs

Your ads are spending. Are they actually performing?
Pulse connects to Google Ads and Meta Ads to explain performance in plain language, diagnose what changed, and recommend specific actions — no data analyst needed.