Meta Ads vs Google Ads: How to Read Performance Without a Data Analyst
 20 Mar 20267 min read
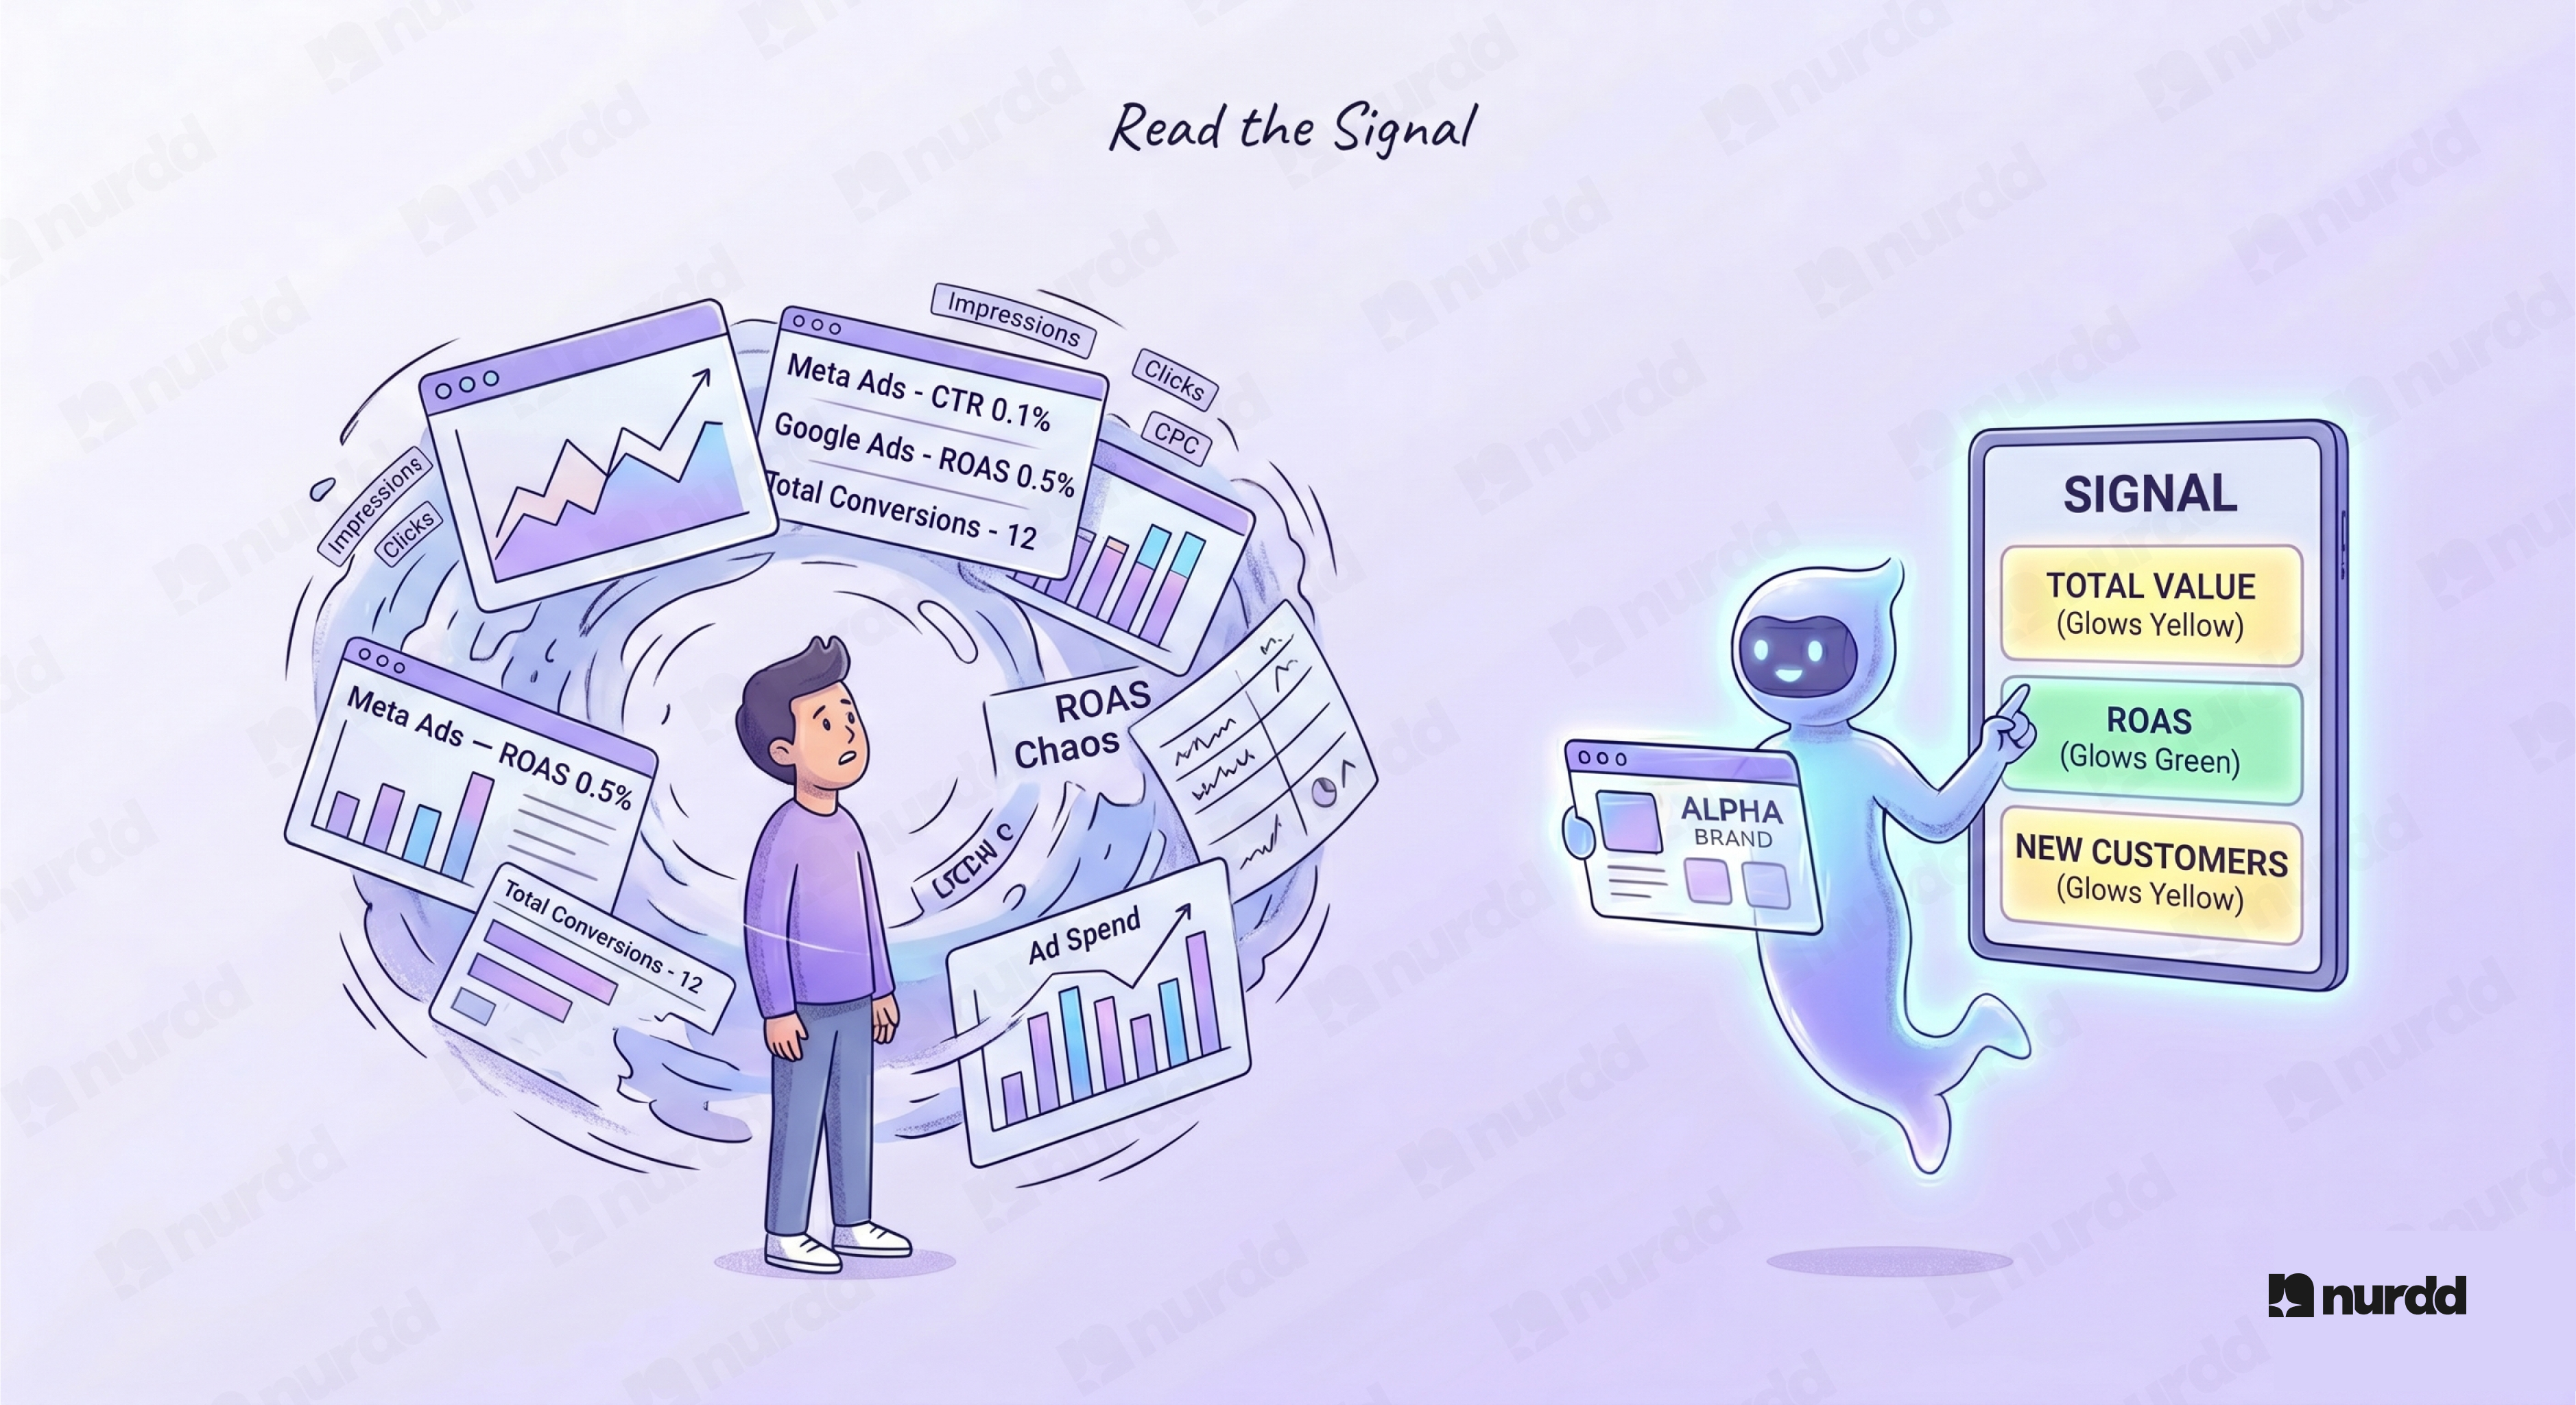
Meta Ads and Google Ads both show you dashboards full of numbers. Most of those numbers are not telling you what you think they are telling you. And the gap between "my ROAS is 3.2x" and "I should increase budget on Campaign A and pause Campaign B" is exactly where most brands lose money.
This guide explains what the most important metrics actually mean — and how to make decisions from them without a data analyst to translate.
The Core Problem: Platforms Report in Their Own Interest
Meta and Google both have an incentive to show you numbers that make their platform look effective. Attributed conversions are inflated by view-through credit windows. ROAS calculations include users who would have purchased anyway. Reach metrics count the same person multiple times across a single day.
This does not mean the platforms are useless — it means you need to know which numbers to trust, which to triangulate, and which to mostly ignore.
Meta Ads: The Metrics That Matter
Cost Per Result (not ROAS)
ROAS tells you revenue attributed to your ads divided by spend. The problem is "attributed" includes view-through conversions — people who saw your ad but did not click, then purchased later. This inflates ROAS considerably. Cost per result is more honest. For a D2C brand, result = purchase. If your target acquisition cost is ₹800 and your cost per purchase on Meta is ₹740, you are inside target. That is the number to watch.
Frequency
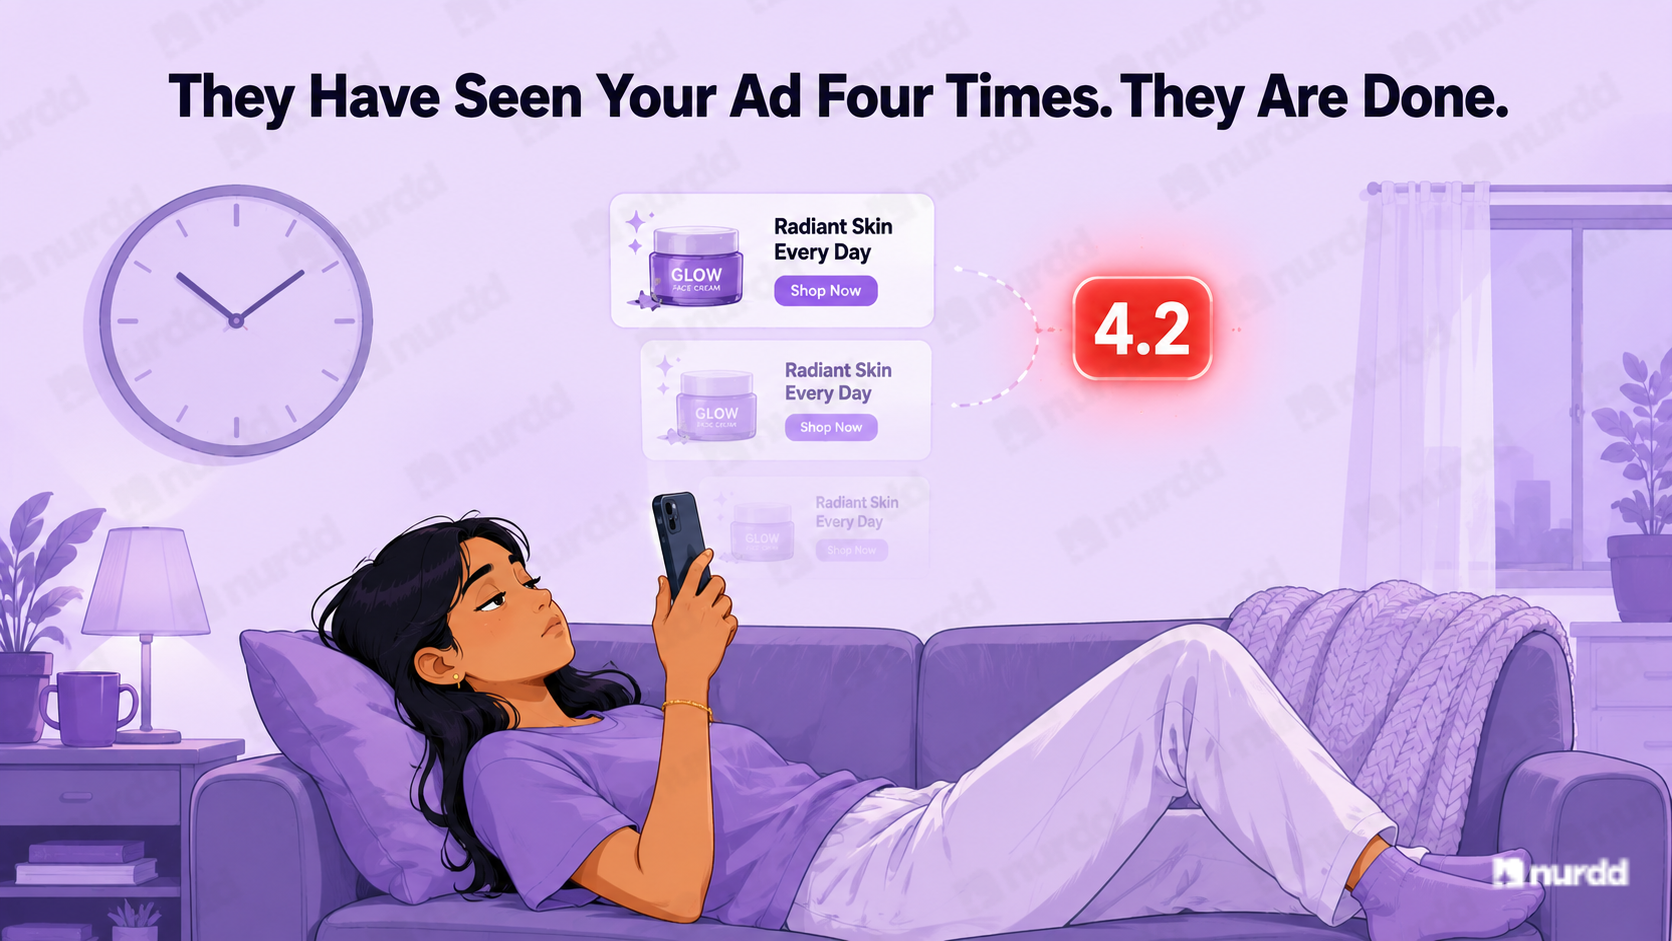
Frequency is the average number of times a single person has seen your ad in a given period. When frequency goes above 3–4, performance typically degrades — the same people are seeing the same ad repeatedly and tuning it out. This is a signal to refresh creative, not to increase budget.
CTR (Link, Not All)
Meta reports two CTR numbers: "All CTR" (includes clicks on your profile picture, like button, etc.) and "Link CTR" (clicks that go to your destination URL). Only Link CTR matters. A good Link CTR for D2C on Meta is 1–2%. Below 0.5% is a creative problem.
CPM Trends
CPM (cost per 1,000 impressions) is your cost to reach people. When CPM rises without a corresponding rise in conversions, you are reaching a less relevant audience — often because your winning audience has been exhausted and the algorithm is expanding. This is when you need to update your targeting or creative.
Google Ads: The Metrics That Matter
Impression Share
Impression Share is the percentage of eligible auctions where your ad actually showed. If your Impression Share is 45%, your ads could theoretically show in twice as many auctions — but you are losing to budget constraints or quality score issues. Low Impression Share combined with high ROAS is a clear signal to increase budget.
Search Term Report vs Keywords
The keywords you bid on are not necessarily the search terms triggering your ads. The Search Term Report (under Keywords) shows the actual queries that generated impressions and clicks. Review this weekly. You will find budget being spent on irrelevant terms that need to be added as negative keywords.
Quality Score
Quality Score (1–10) reflects how relevant Google considers your ad, keyword, and landing page combination to be. Low Quality Score means you are paying more per click than competitors for the same placement. Improving Quality Score — by tightening keyword-to-ad-to-landing-page relevance — can reduce CPC by 20–40% without changing bid strategy.
Conversion Lag
Google optimises toward conversions it can see. If your product has a long consideration cycle (people click an ad and purchase 7–14 days later), you need a conversion window that captures that lag. Check that your conversion window actually matches your buyer's decision timeline.
The Decision Framework
| What you see | What it means | What to do |
|---|---|---|
| High ROAS, low spend | Profitable campaign limited by budget | Increase daily budget |
| Rising CPM, flat conversions | Audience exhaustion | New creative or expanded audience |
| High frequency (4+) | Ad fatigue | Refresh creatives immediately |
| Low CTR (<0.5%) | Creative not resonating | Test new hooks, formats, or offers |
| Low Impression Share | Budget-limited in winning auctions | Increase budget or tighten targeting |
| Rising CPC, flat conversion rate | Competitive pressure | Improve Quality Score or adjust bids |
Why Most Brands Still Struggle With This
The decision framework above sounds simple. In practice, most brands cannot execute it because:
- The data lives across multiple campaigns, ad sets, and platforms with no unified view
- The patterns that matter — frequency spikes, CPM trends, Impression Share drops — require time-series analysis, not just a snapshot
- Knowing what the numbers mean is different from knowing which campaigns to act on first
This is the problem Pulse by Nurdd solves. Pulse connects to your Meta Ads and Google Ads accounts via read-only OAuth and automatically diagnoses your account — explaining what changed, why performance shifted, and what to prioritise. No reports to build, no analyst required. The free tier provides a full account audit with no credit card needed.
The One-Page Summary
Meta Ads: Watch Cost per Result, Frequency, Link CTR, and CPM trends. Google Ads: Watch Impression Share, Search Term Report, Quality Score, and Conversion Lag. When numbers move, understand the cause before changing spend. Most budget waste in paid media comes from reacting to symptoms without diagnosing root causes.
Platform dashboards are designed to show you that advertising is working. Your job is to find where it is not — and fix those parts first.

Your ads are spending. Are they actually performing?
Pulse connects to Google Ads and Meta Ads to explain performance in plain language, diagnose what changed, and recommend specific actions — no data analyst needed.