Creator Attribution for Offline Conversions: The D2C Brand Playbook for 2026
 23 Mar 20269 min read
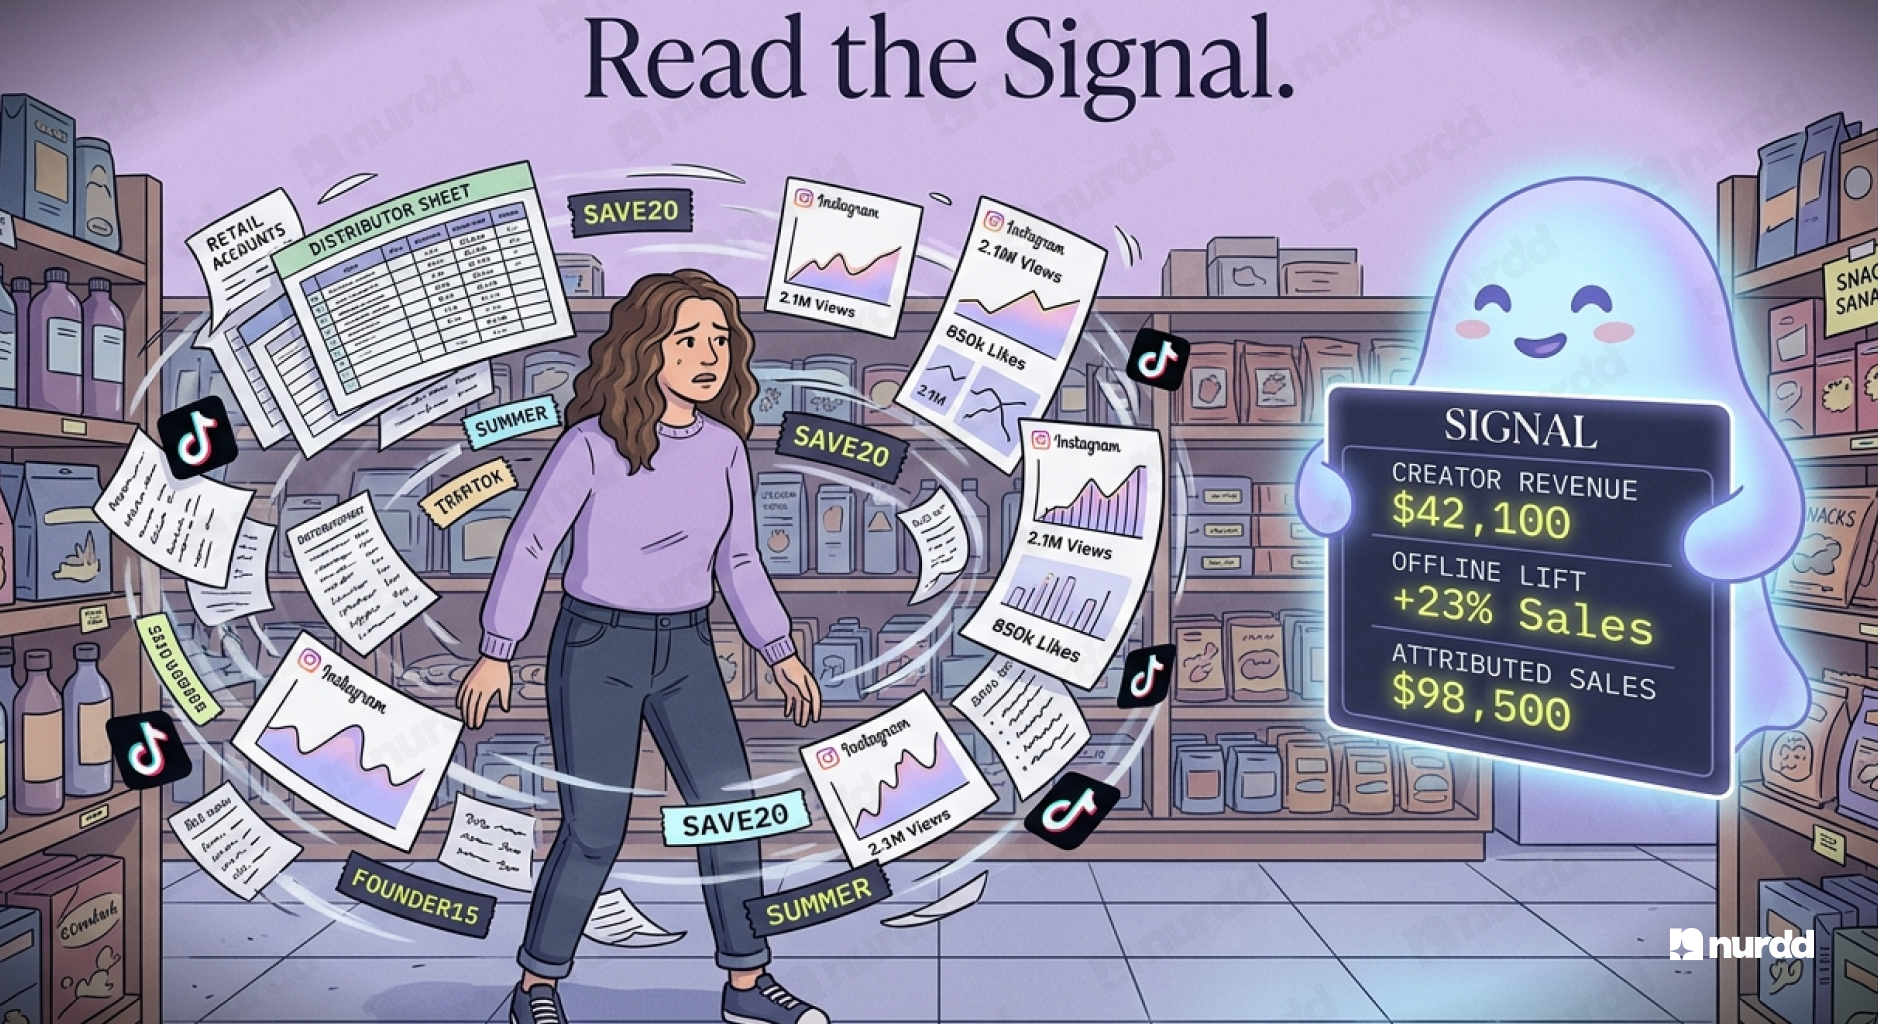
You run a D2C brand. You sell on your website, on Amazon, and in 200 Modern Trade outlets across India. You brief five creators on a campaign. The Reels go live. Three days later, your offline sales in Bangalore spike by 18 percent. You have no idea which creator caused that.
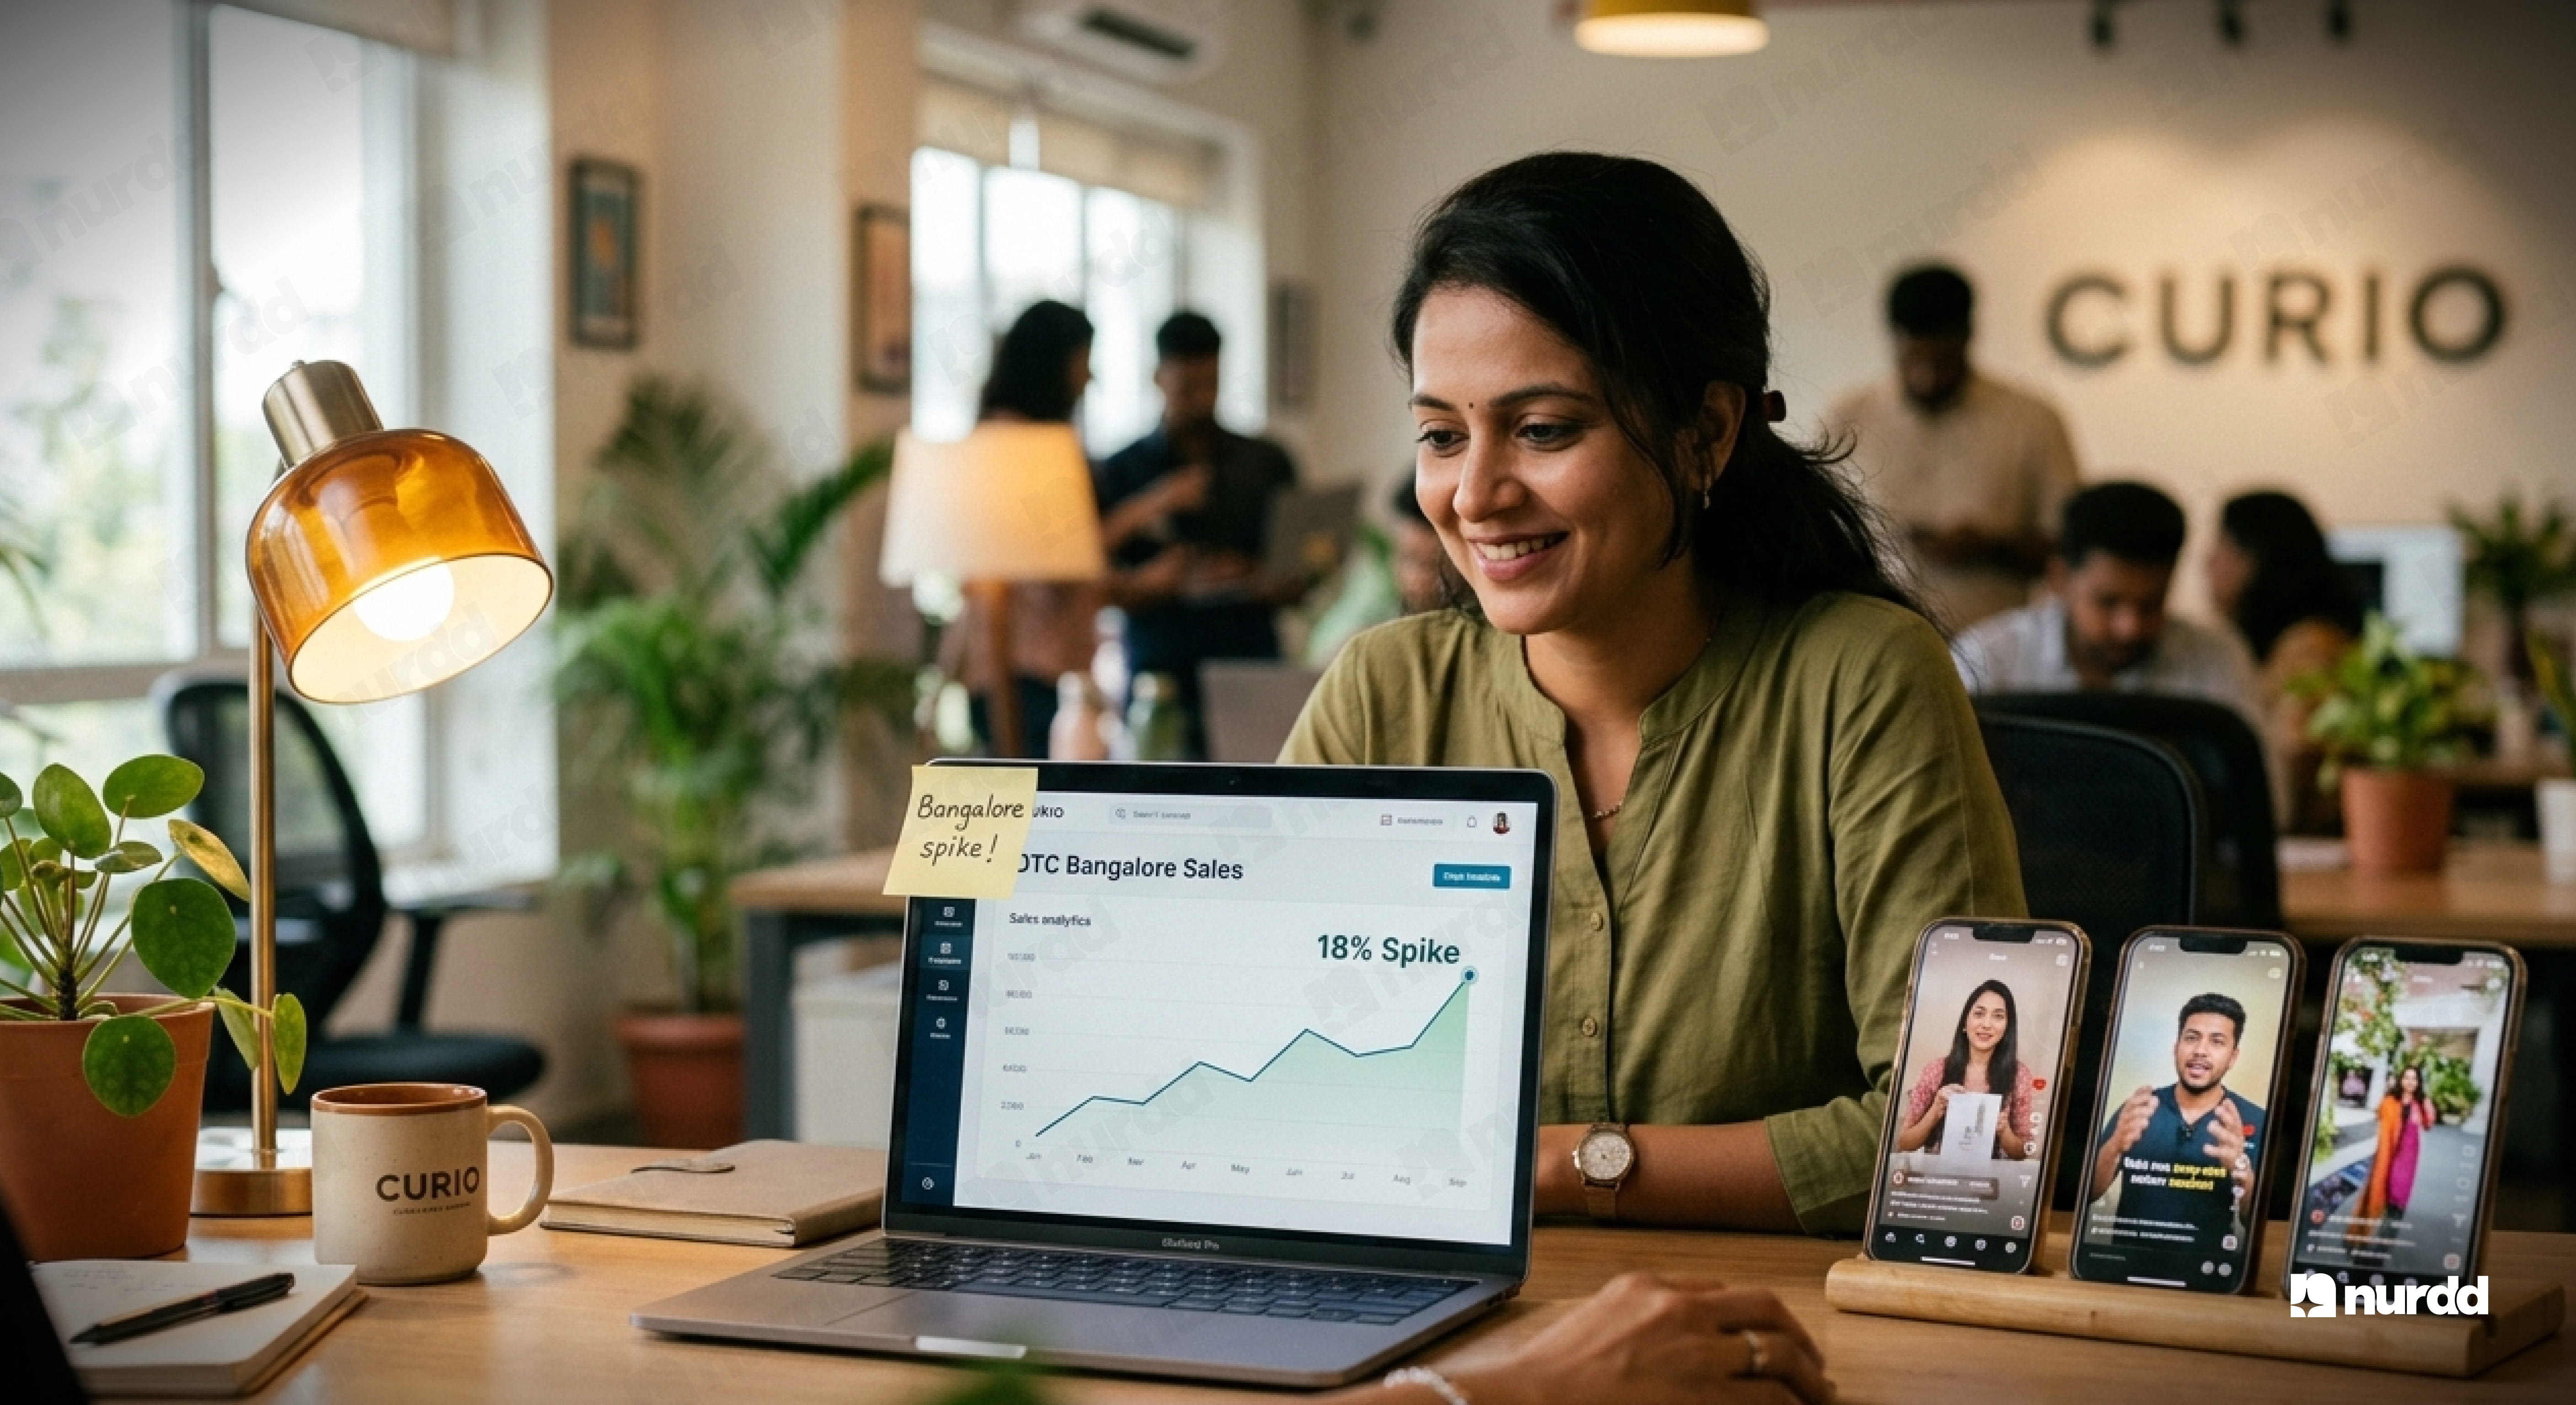
This is the offline attribution problem. In 2026, with the majority of Indian D2C brand revenue still flowing through offline channels according to CBRE and Redseer data, it is no longer acceptable to shrug and move on.
Why Offline Attribution Is Harder Than It Looks
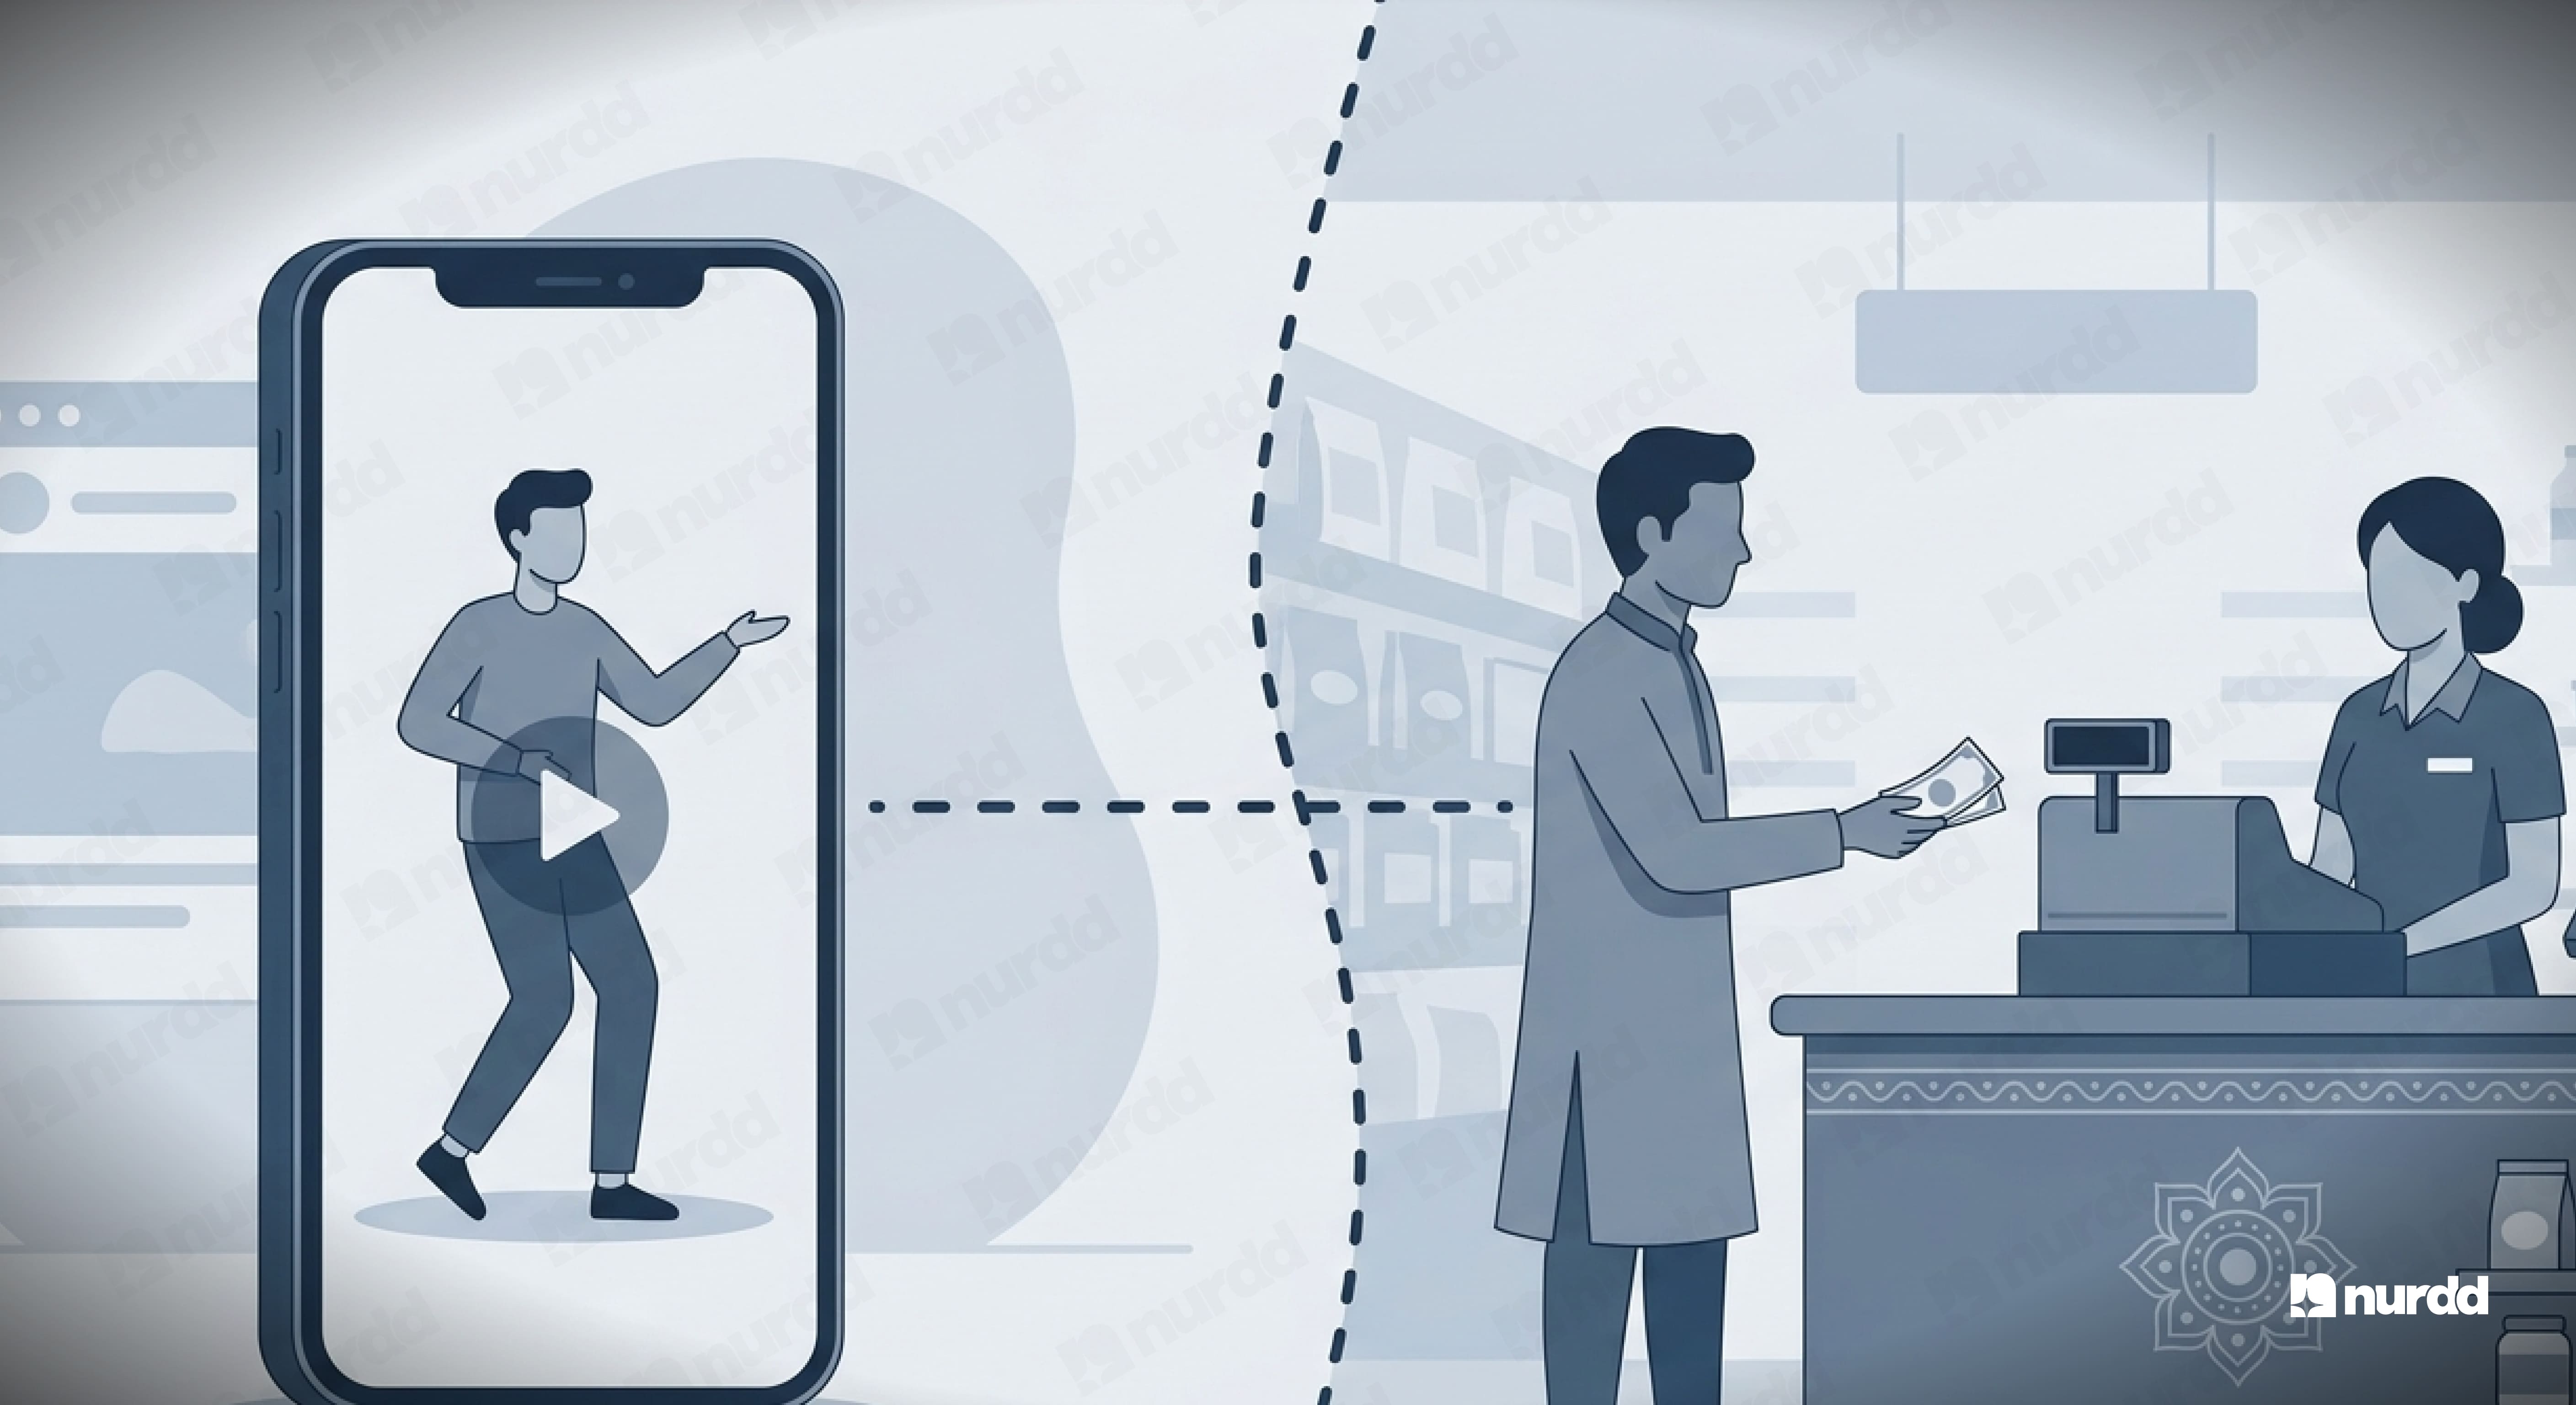
Online attribution is already messy. You have last-click models, UTM gaps, iOS privacy changes, and cookie deprecation eating into your tracking. Offline attribution adds a second layer of distance between the creator's content and the eventual transaction.
The four gaps that make this hard:
• Time delay: Offline purchases often happen days or weeks after the content was consumed.
• No click event: The consumer did not tap a link. They remembered the brand.
• Channel mixing: They may have seen a Meta ad, a creator Reel, and a store display before buying.
• POS data silos: Most offline sales data lives in distributor systems that never talk to your marketing stack.
The Five Methods That Actually Work in 2026
1. Creator-Specific Promo Codes at Offline Point of Sale
Each creator gets a unique discount code, for example RHEA10 or SHREY15, that applies at checkout both online and offline. What this gives you: exact revenue per creator, offline vs online split, conversion rate by creator audience.
If your product sells through large modern trade chains, negotiate creator code support as part of your annual trade contract. It costs the retailer nothing and gives your team data worth more than the discount margin.
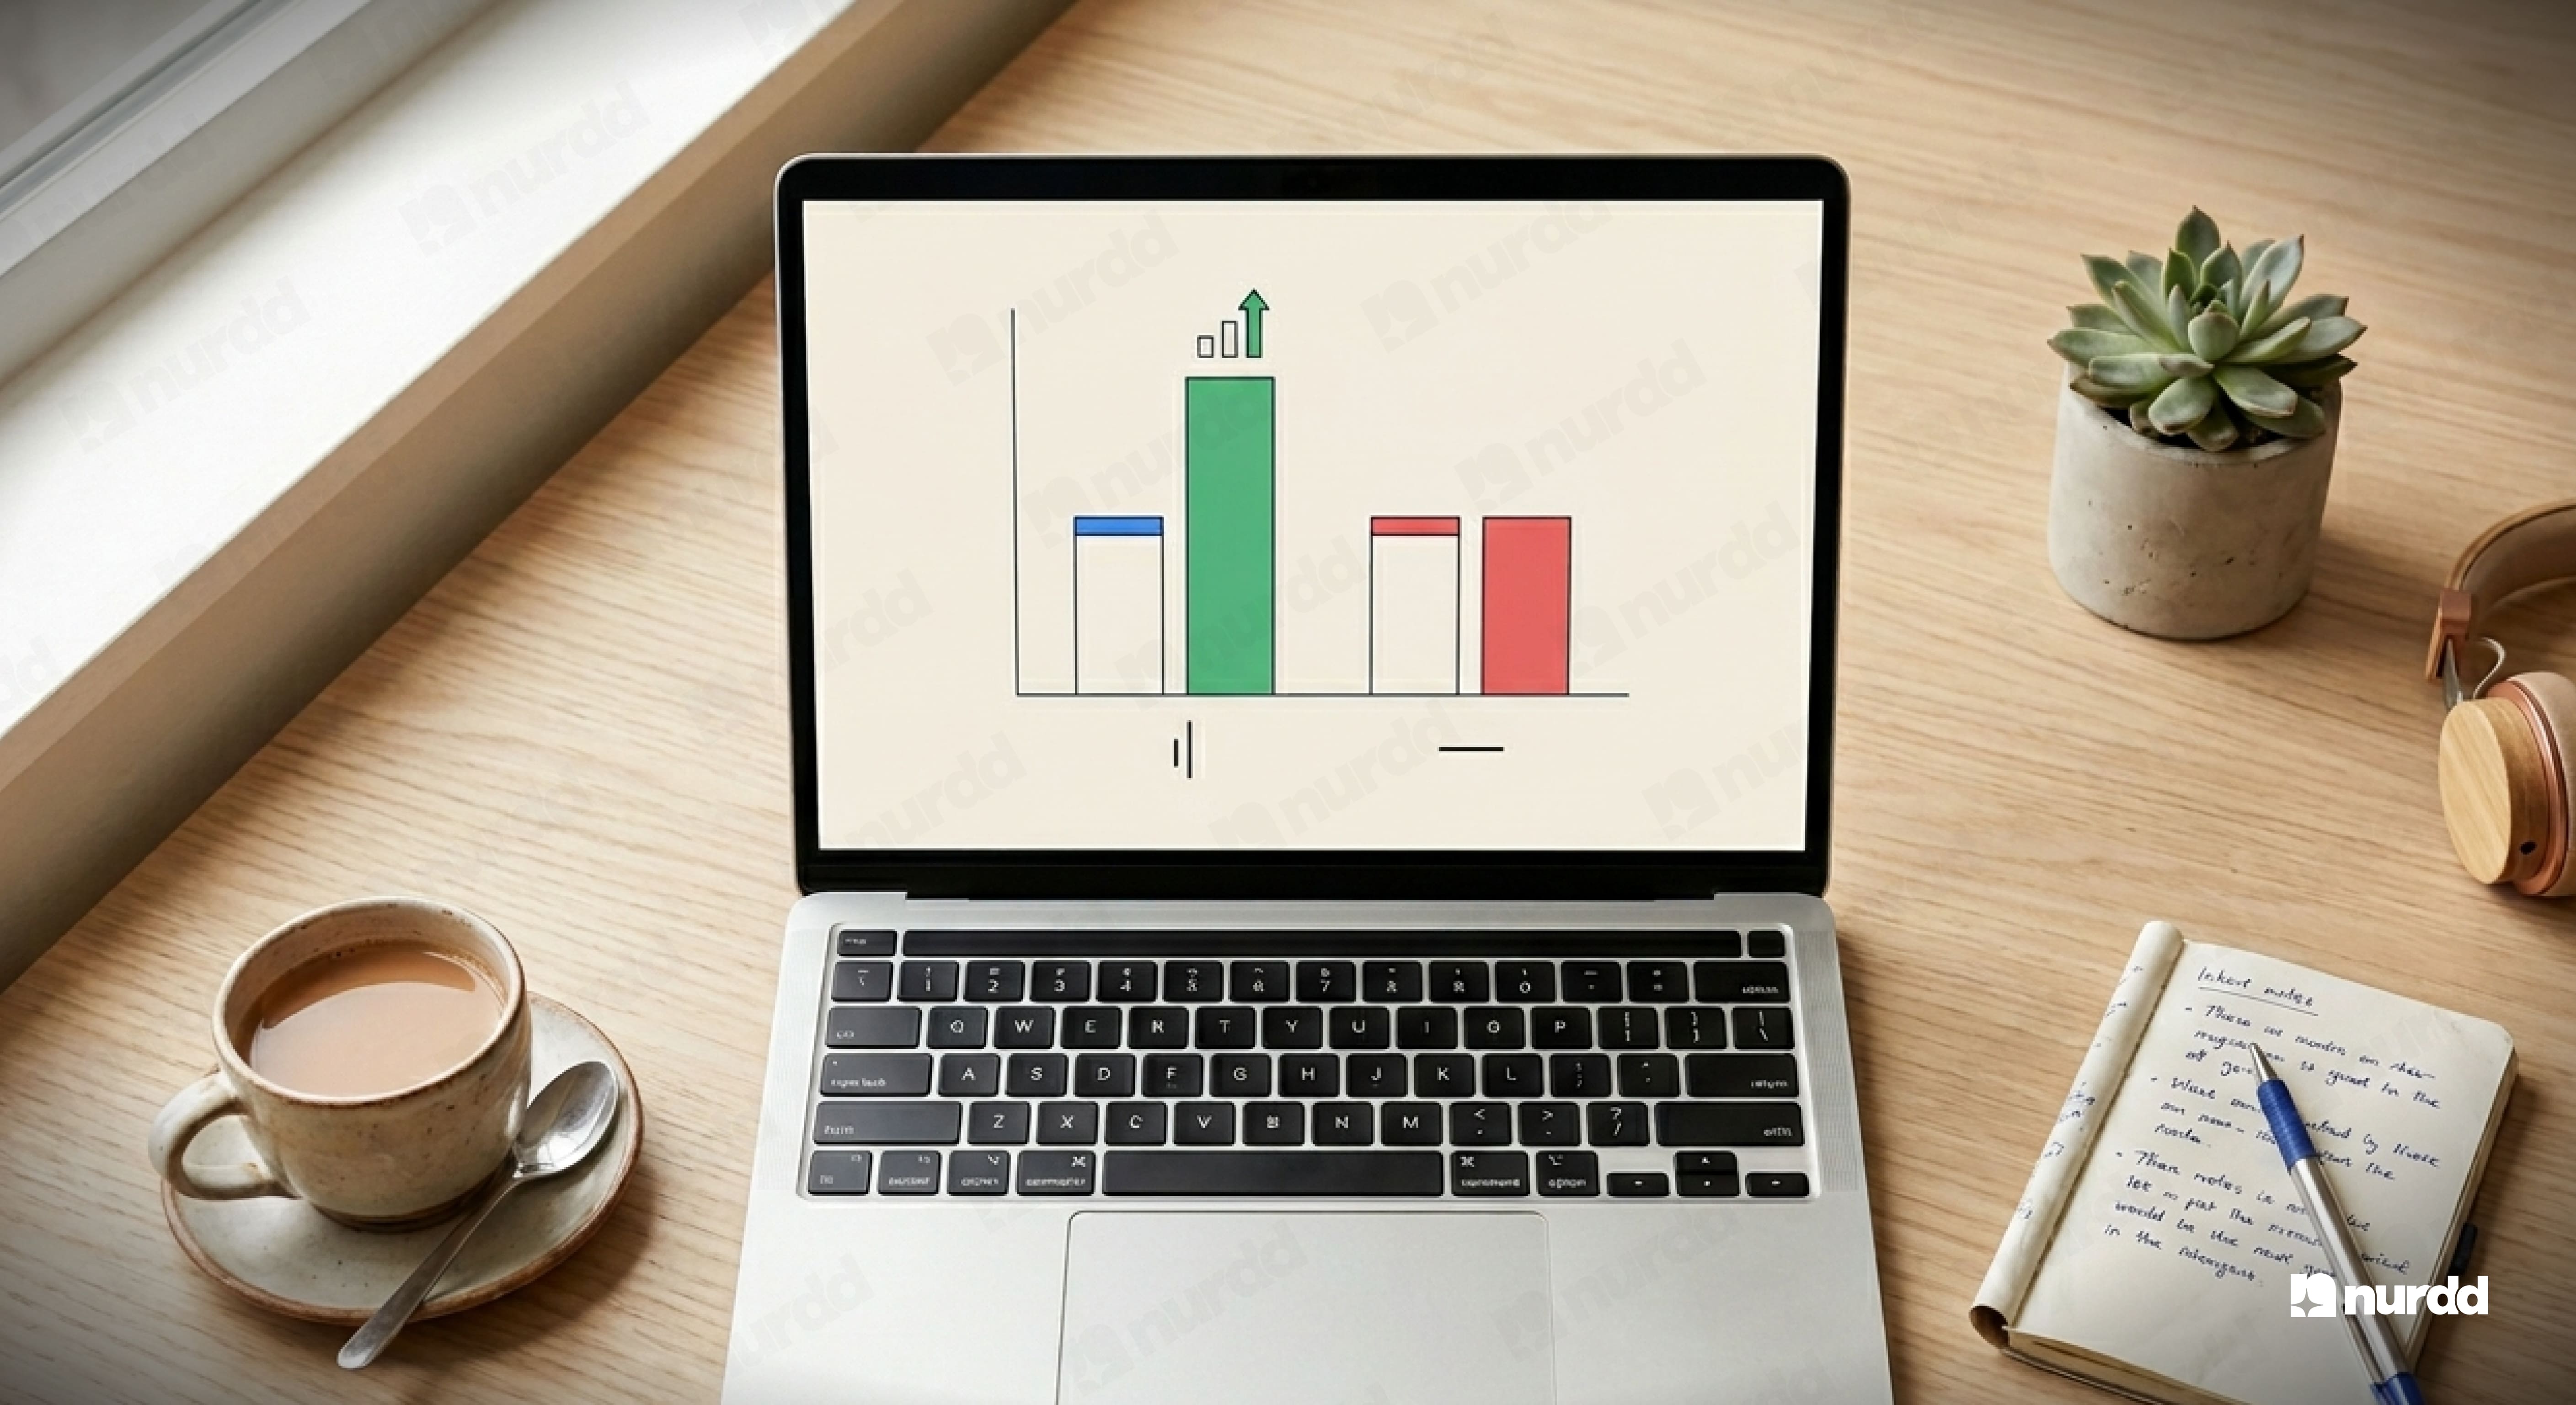
2. Geo-Holdout Testing
Run your creator campaign in specific cities and hold back equivalent cities as a control group. Measure the difference in offline sales velocity between the two groups.
• Select city pairs that are demographically matched. Pune and Ahmedabad work well for most D2C categories.
• Ensure creators have audiences concentrated in the test cities. Verify audience location data before briefing.
• Run for a minimum of four weeks. Short windows generate noise, not signal.
• Compare week-over-week offline sales in test vs control using your distributor or Nielsen data.
3. Unique QR Codes in Creator Content
Brief creators to include a scannable QR code. When a consumer scans this at a physical store, the scan event is logged against the creator. QR attribution works especially well for food and beverage, beauty, and health and wellness brands.
4. Mobile Number Matching via UPI Transactions
When a customer pays via UPI at an offline outlet, the mobile number is captured. If that same mobile number exists in your CRM because they previously clicked a creator link, you can match the two events. Match rate is typically 15 to 35 percent but the data is deterministic.
5. Creator-Led Retailer Activations
Brief creators to physically visit a store, shoot content inside, and drive their audience to that specific outlet using a location tag. Offline footfall can be measured via retailer-shared footfall data or in-store QR scans.
Benchmarks: What Good Offline Attribution Looks Like
• Promo code redemption rate at offline POS: 3 to 7 percent of consumers who see creator content
• Geo-holdout lift from a well-executed creator campaign: 8 to 22 percent incremental offline sales in test cities
• QR code scan-to-purchase conversion: 4 to 12 percent depending on category and incentive
• UPI mobile match rate: 15 to 35 percent of offline transactions
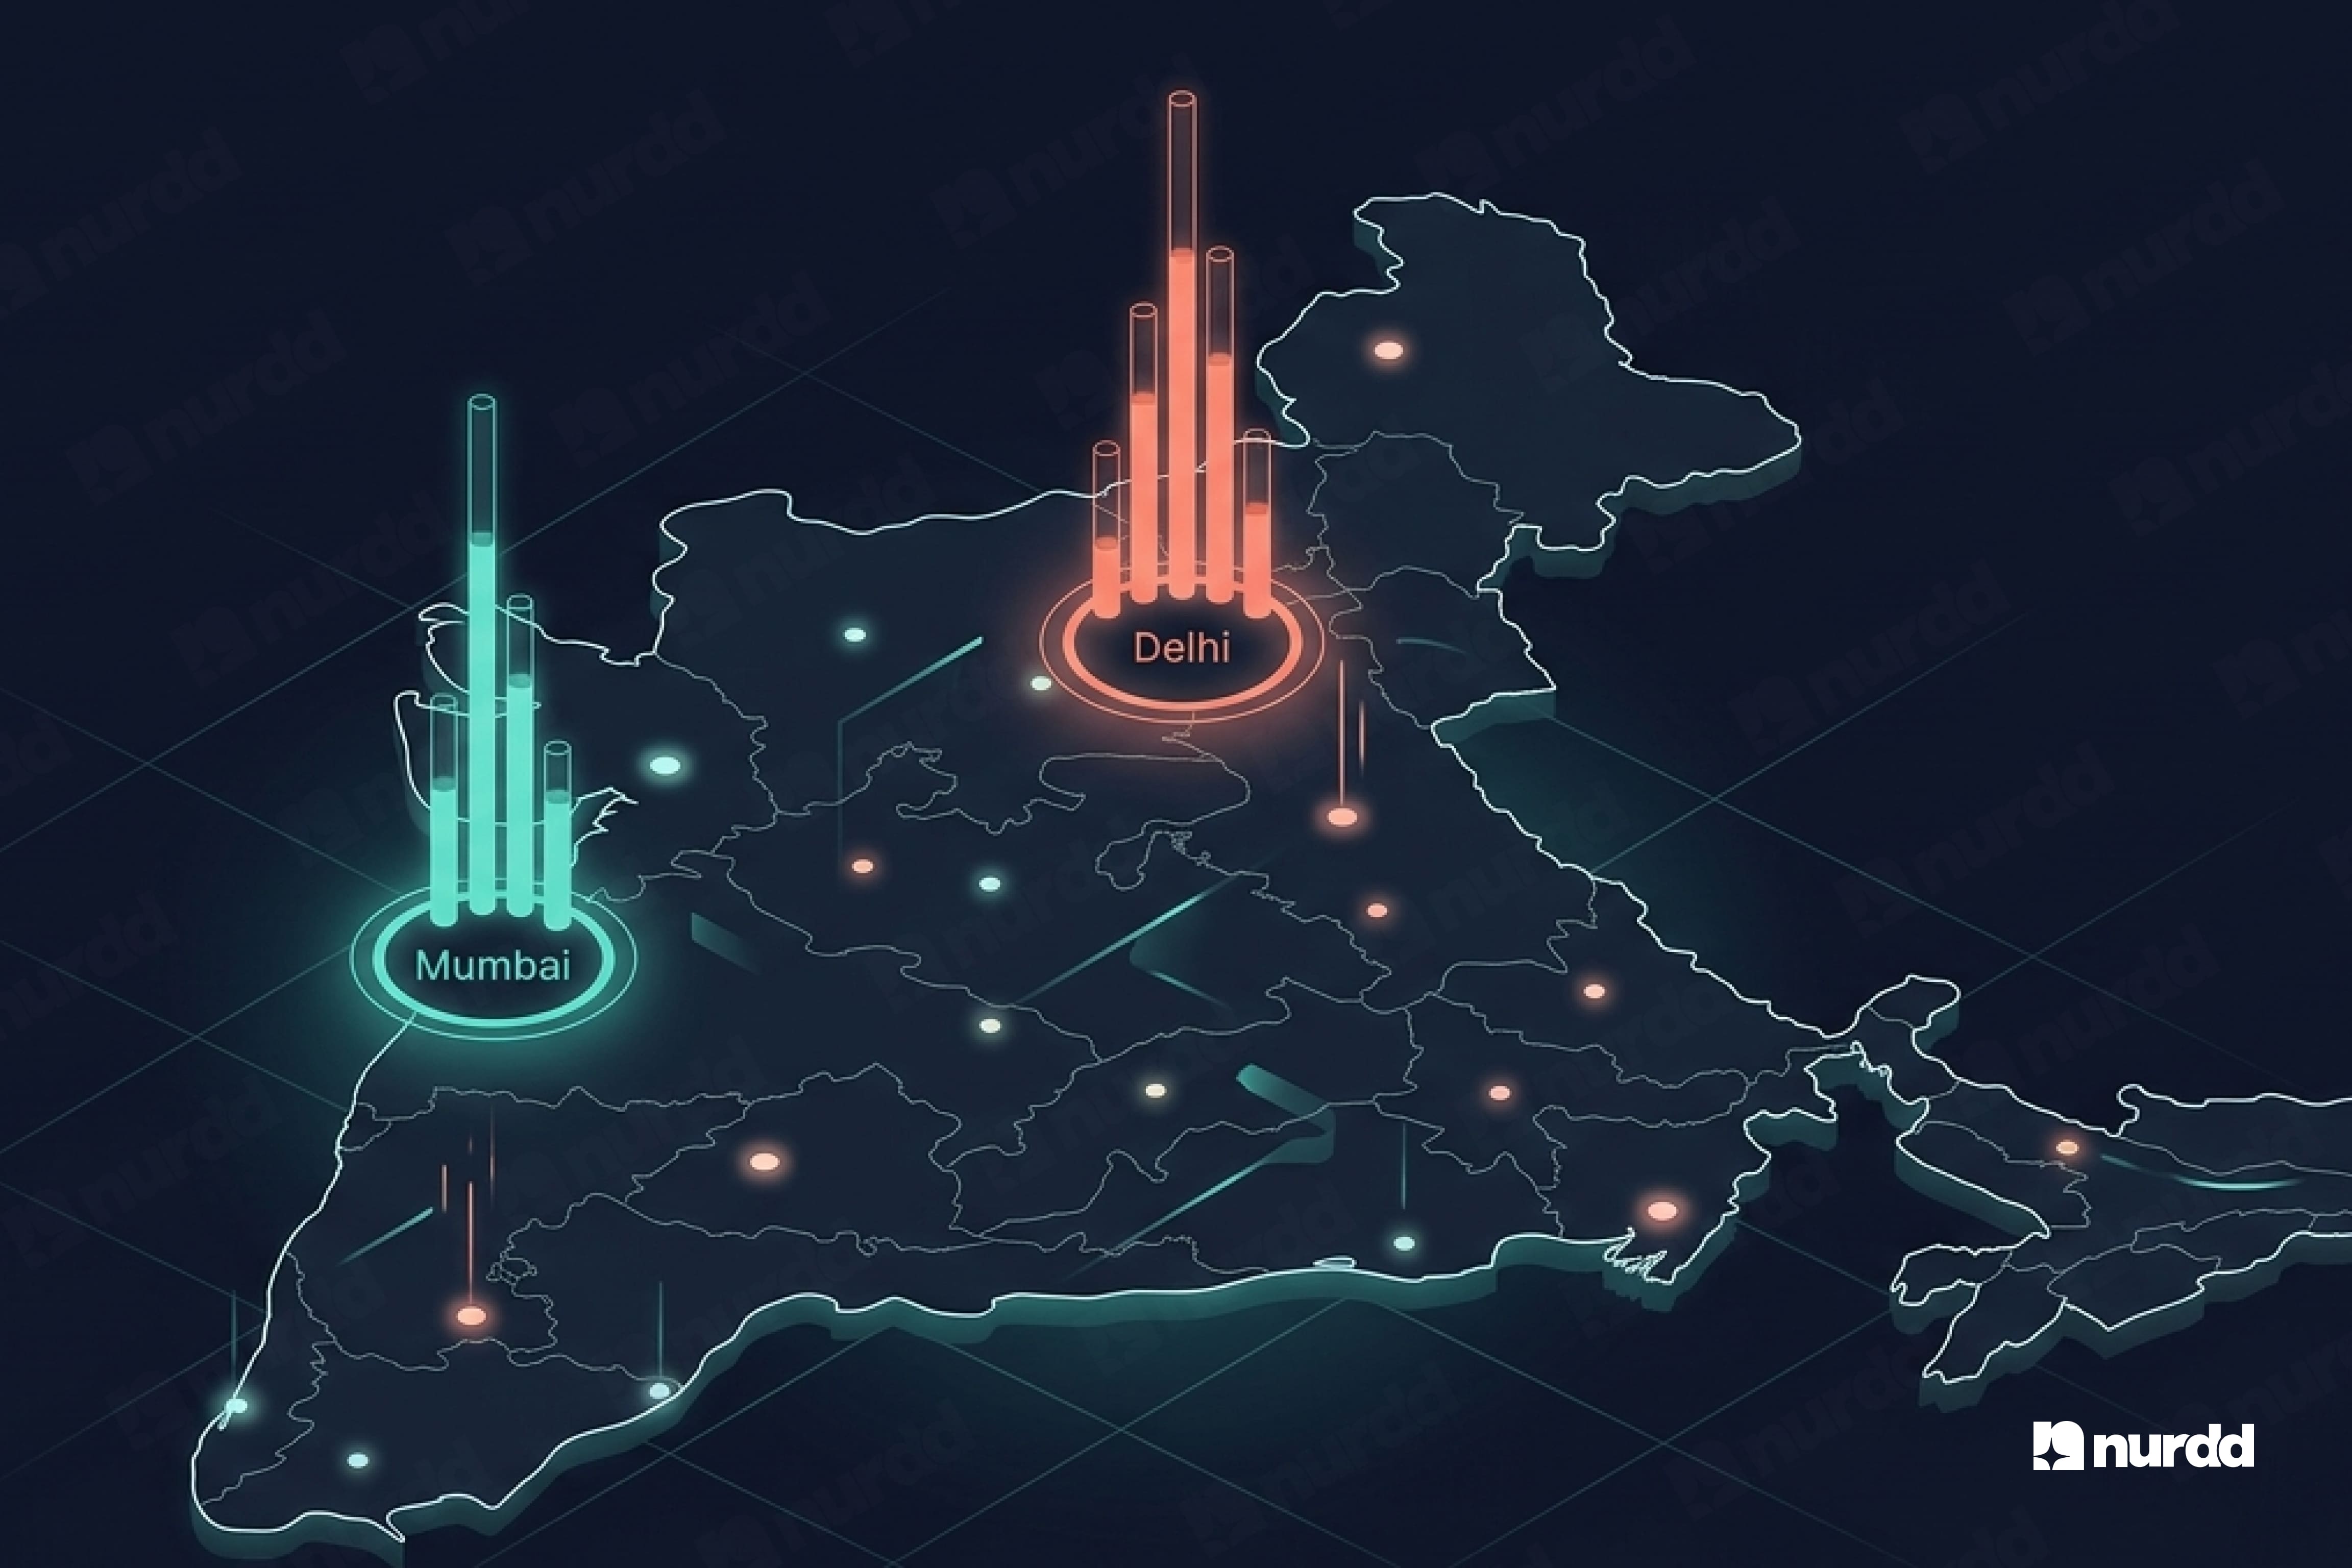
Start with one geo-holdout test this quarter. Run one creator campaign targeting Mumbai. Hold back Delhi as your control. Check your distributor data at the end of the month. You will have more signal in four weeks than you got in the last 12 months of Instagram analytics.
Sources and References
CBRE (2025) – India's D2C Revolution: The New Retail Order | cbre.com
Redseer (2023) – Indian D2C Market Outlook | redseer.com
Franchise India (2025) – D2C Brands & Offline Expansion | franchiseindia.com
Mordor Intelligence (2026) – India D2C E-Commerce Market Report | mordorintelligence.com
Nielsen RMS – Offline Sales Lift Measurement | nielsen.com
Google (2024) – Google Ads Enhanced Conversions Documentation | support.google.com/google-ads

Find the right creators — and verify they're real.
Nia gives D2C brands access to 10M+ Indian creator profiles, TruAI fake follower detection, pre-spend ROI forecasting, and product-level sales attribution. Completely free.