ROAS tells you what happened. Incrementality tells you what would not have happened without you. Most Indian D2C brands optimize for the first number and never ask the second question. That is how they end up paying creators to reach people who were already going to buy.
What Incrementality Actually Measures
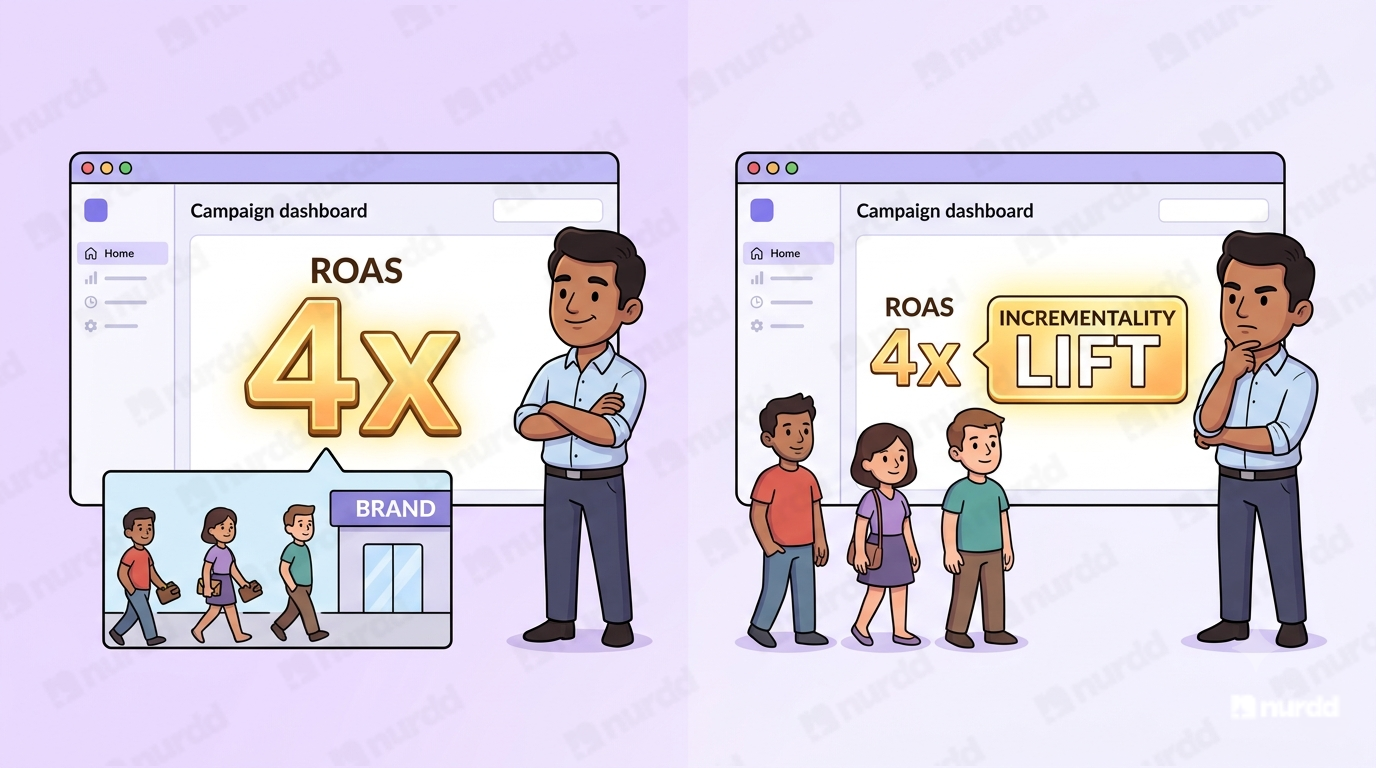
Incrementality is the lift in sales caused specifically by your influencer campaign net of what would have occurred anyway through organic demand, brand search, or other channels.
A campaign with a 4x ROAS might have an incrementality of zero if those buyers were already in your funnel, already searching for your brand, or would have converted through a different touchpoint. Paying a creator to reach someone who was going to buy anyway is a cost, not a return.
The question incrementality testing answers: 'Would these sales have happened without this creator campaign?'
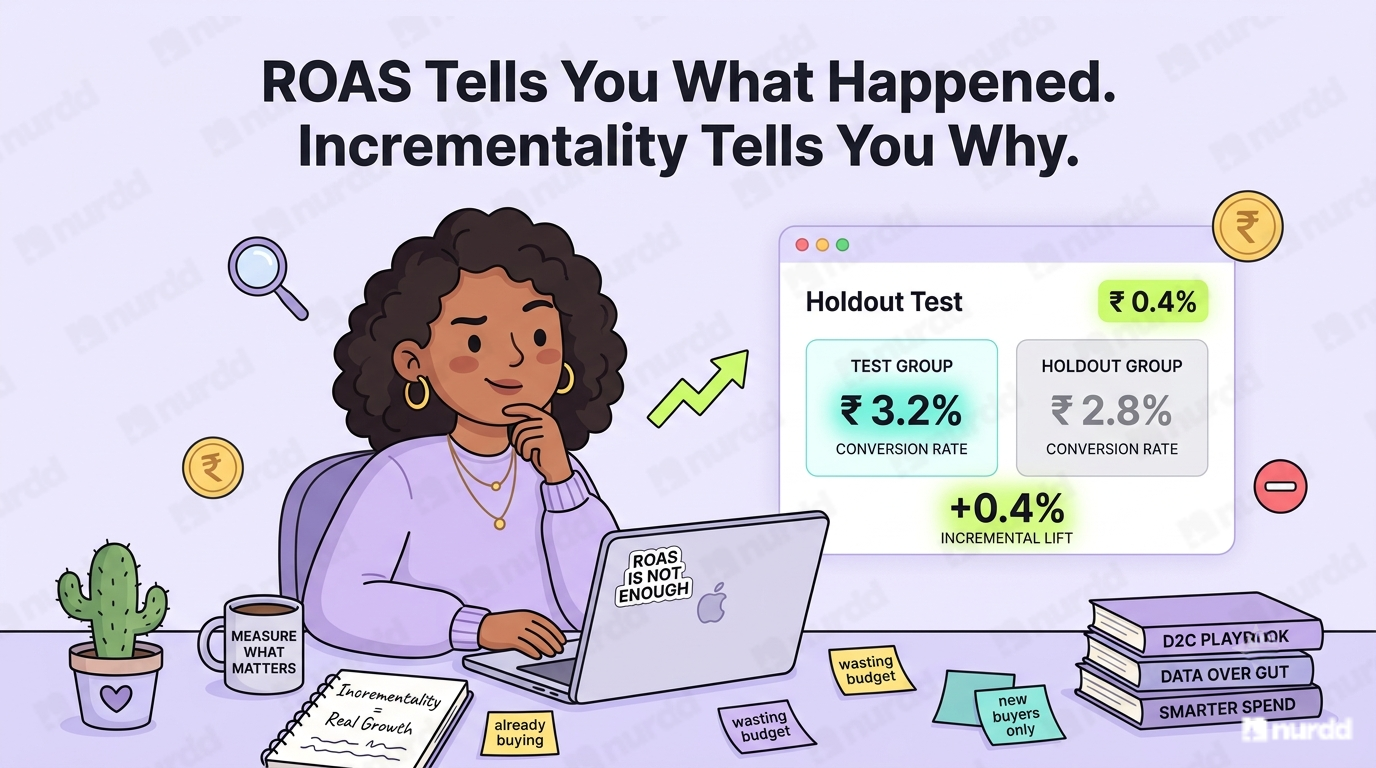
The Holdout Test: The Simplest Incrementality Method
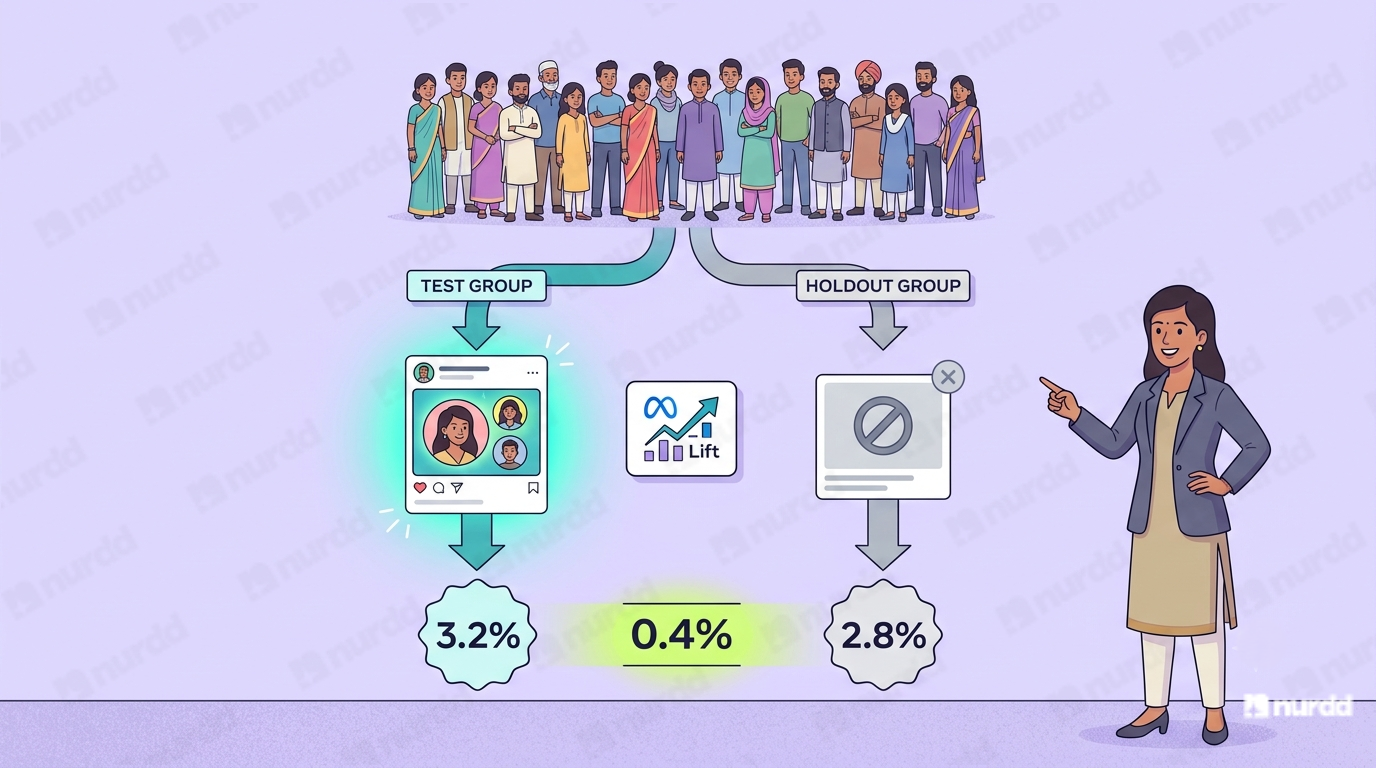
A holdout test splits your target audience into two groups. The test group sees your influencer campaign content. The holdout group is intentionally excluded from seeing it. After the campaign, you compare purchase rates between the two groups.
The difference in conversion rate between the exposed group and the holdout group is your incremental lift. If the exposed group converts at 3.2% and the holdout group converts at 2.8%, your incrementality is 0.4 percentage points meaning your campaign drove that gap.
On Meta, holdout tests can be set up using Meta's Conversion Lift tool. For influencer-specific campaigns using whitelisting, you run the creator's ads to the test group and suppress them for the holdout using audience exclusions.
Geo-Lift Testing for Broader Campaigns
When you cannot control individual audience exposure for example, when a creator posts organically to their full following geo-lift testing is the alternative.
Select two sets of cities or regions that are demographically and commercially similar. Run your influencer campaign in one set. Do nothing in the other. Compare sales velocity across the two regions during and after the campaign period.
For Indian D2C brands, this works well across metro vs metro comparisons Mumbai vs Delhi, Bengaluru vs Hyderabad or across Tier-2 city clusters. The key is baseline equivalence: your test and control regions need similar pre-campaign sales trends.
Geo-lift is less precise than holdout tests but more practical for organic creator campaigns where audience-level suppression is not possible.
What to Do With Incrementality Data
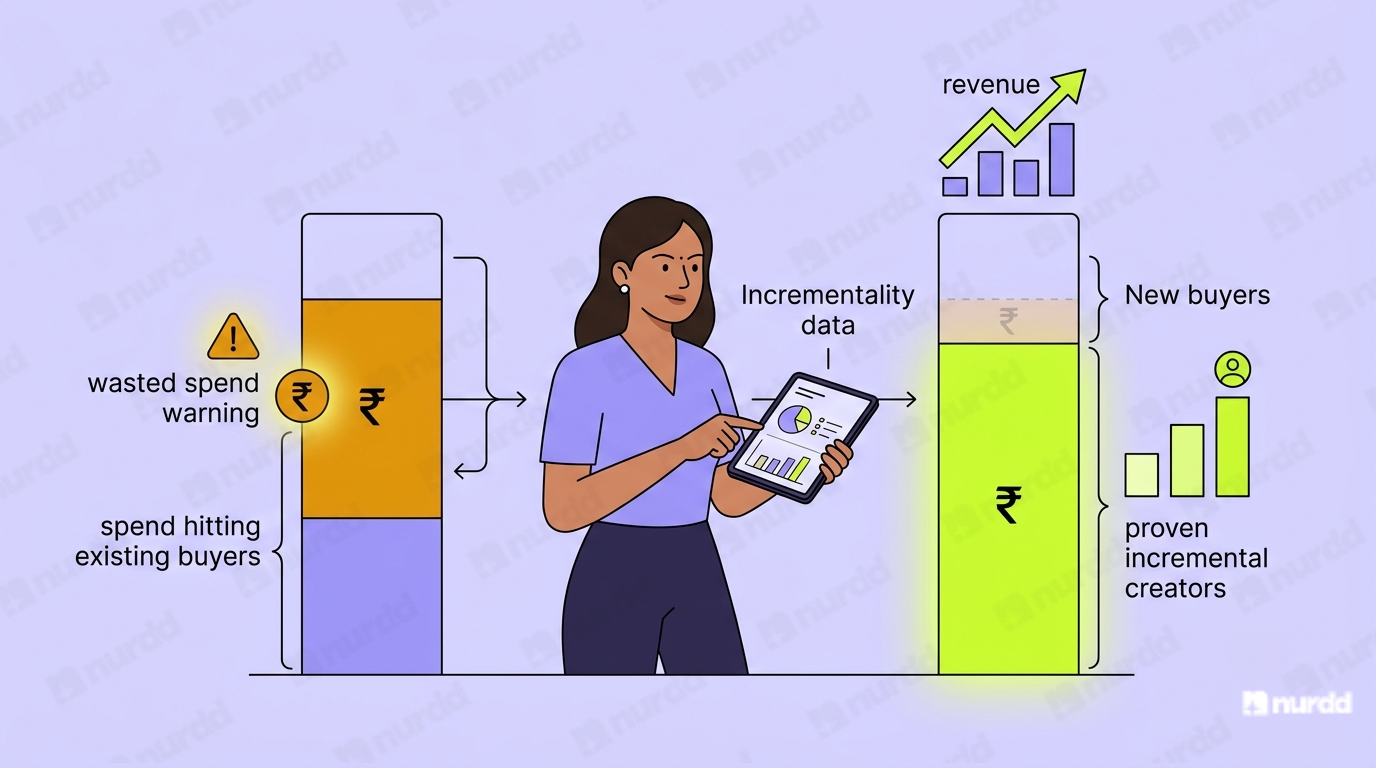
Incrementality data answers three questions that ROAS cannot: Which creators are actually driving new buyers vs recirculating existing demand? Which content formats create genuine purchase intent vs engagement that does not convert? Which audience segments are most incremental to your growth?
Brands that run incrementality tests consistently find that 20 to 30 percent of their influencer spend is hitting audiences who would have bought anyway. That is not a small number. Reallocating that spend toward creators and formats with proven incrementality is one of the highest-leverage moves available in influencer budget management.
The NIA Incrementality Layer
Nia's attribution engine tracks purchase behavior at the audience segment level, not just at the campaign level. By combining UTM data, dark social signals, and purchase timing, Nia builds an incrementality proxy for each creator campaign without requiring a formal holdout test for every activation.
For brands running Nia, this means incrementality data is built into performance reports by default, not a separate experiment you have to design and run manually.
A campaign with a great ROAS and zero incrementality is just an expensive way to reach people who were already coming. Run the test before you scale the budget.
Sources & References
· Meta Business (2025) – Conversion Lift Studies: Methodology Guide | business.meta.com
· Nielsen (2025) – Marketing Mix Modeling in Indian D2C: Incrementality Benchmarks | nielsen.com
· Google (2025) – Geo-Lift Experiments for Paid and Organic Campaigns | support.google.com
· Harvard Business Review (2024) – Measuring What Advertising Actually Does | hbr.org