
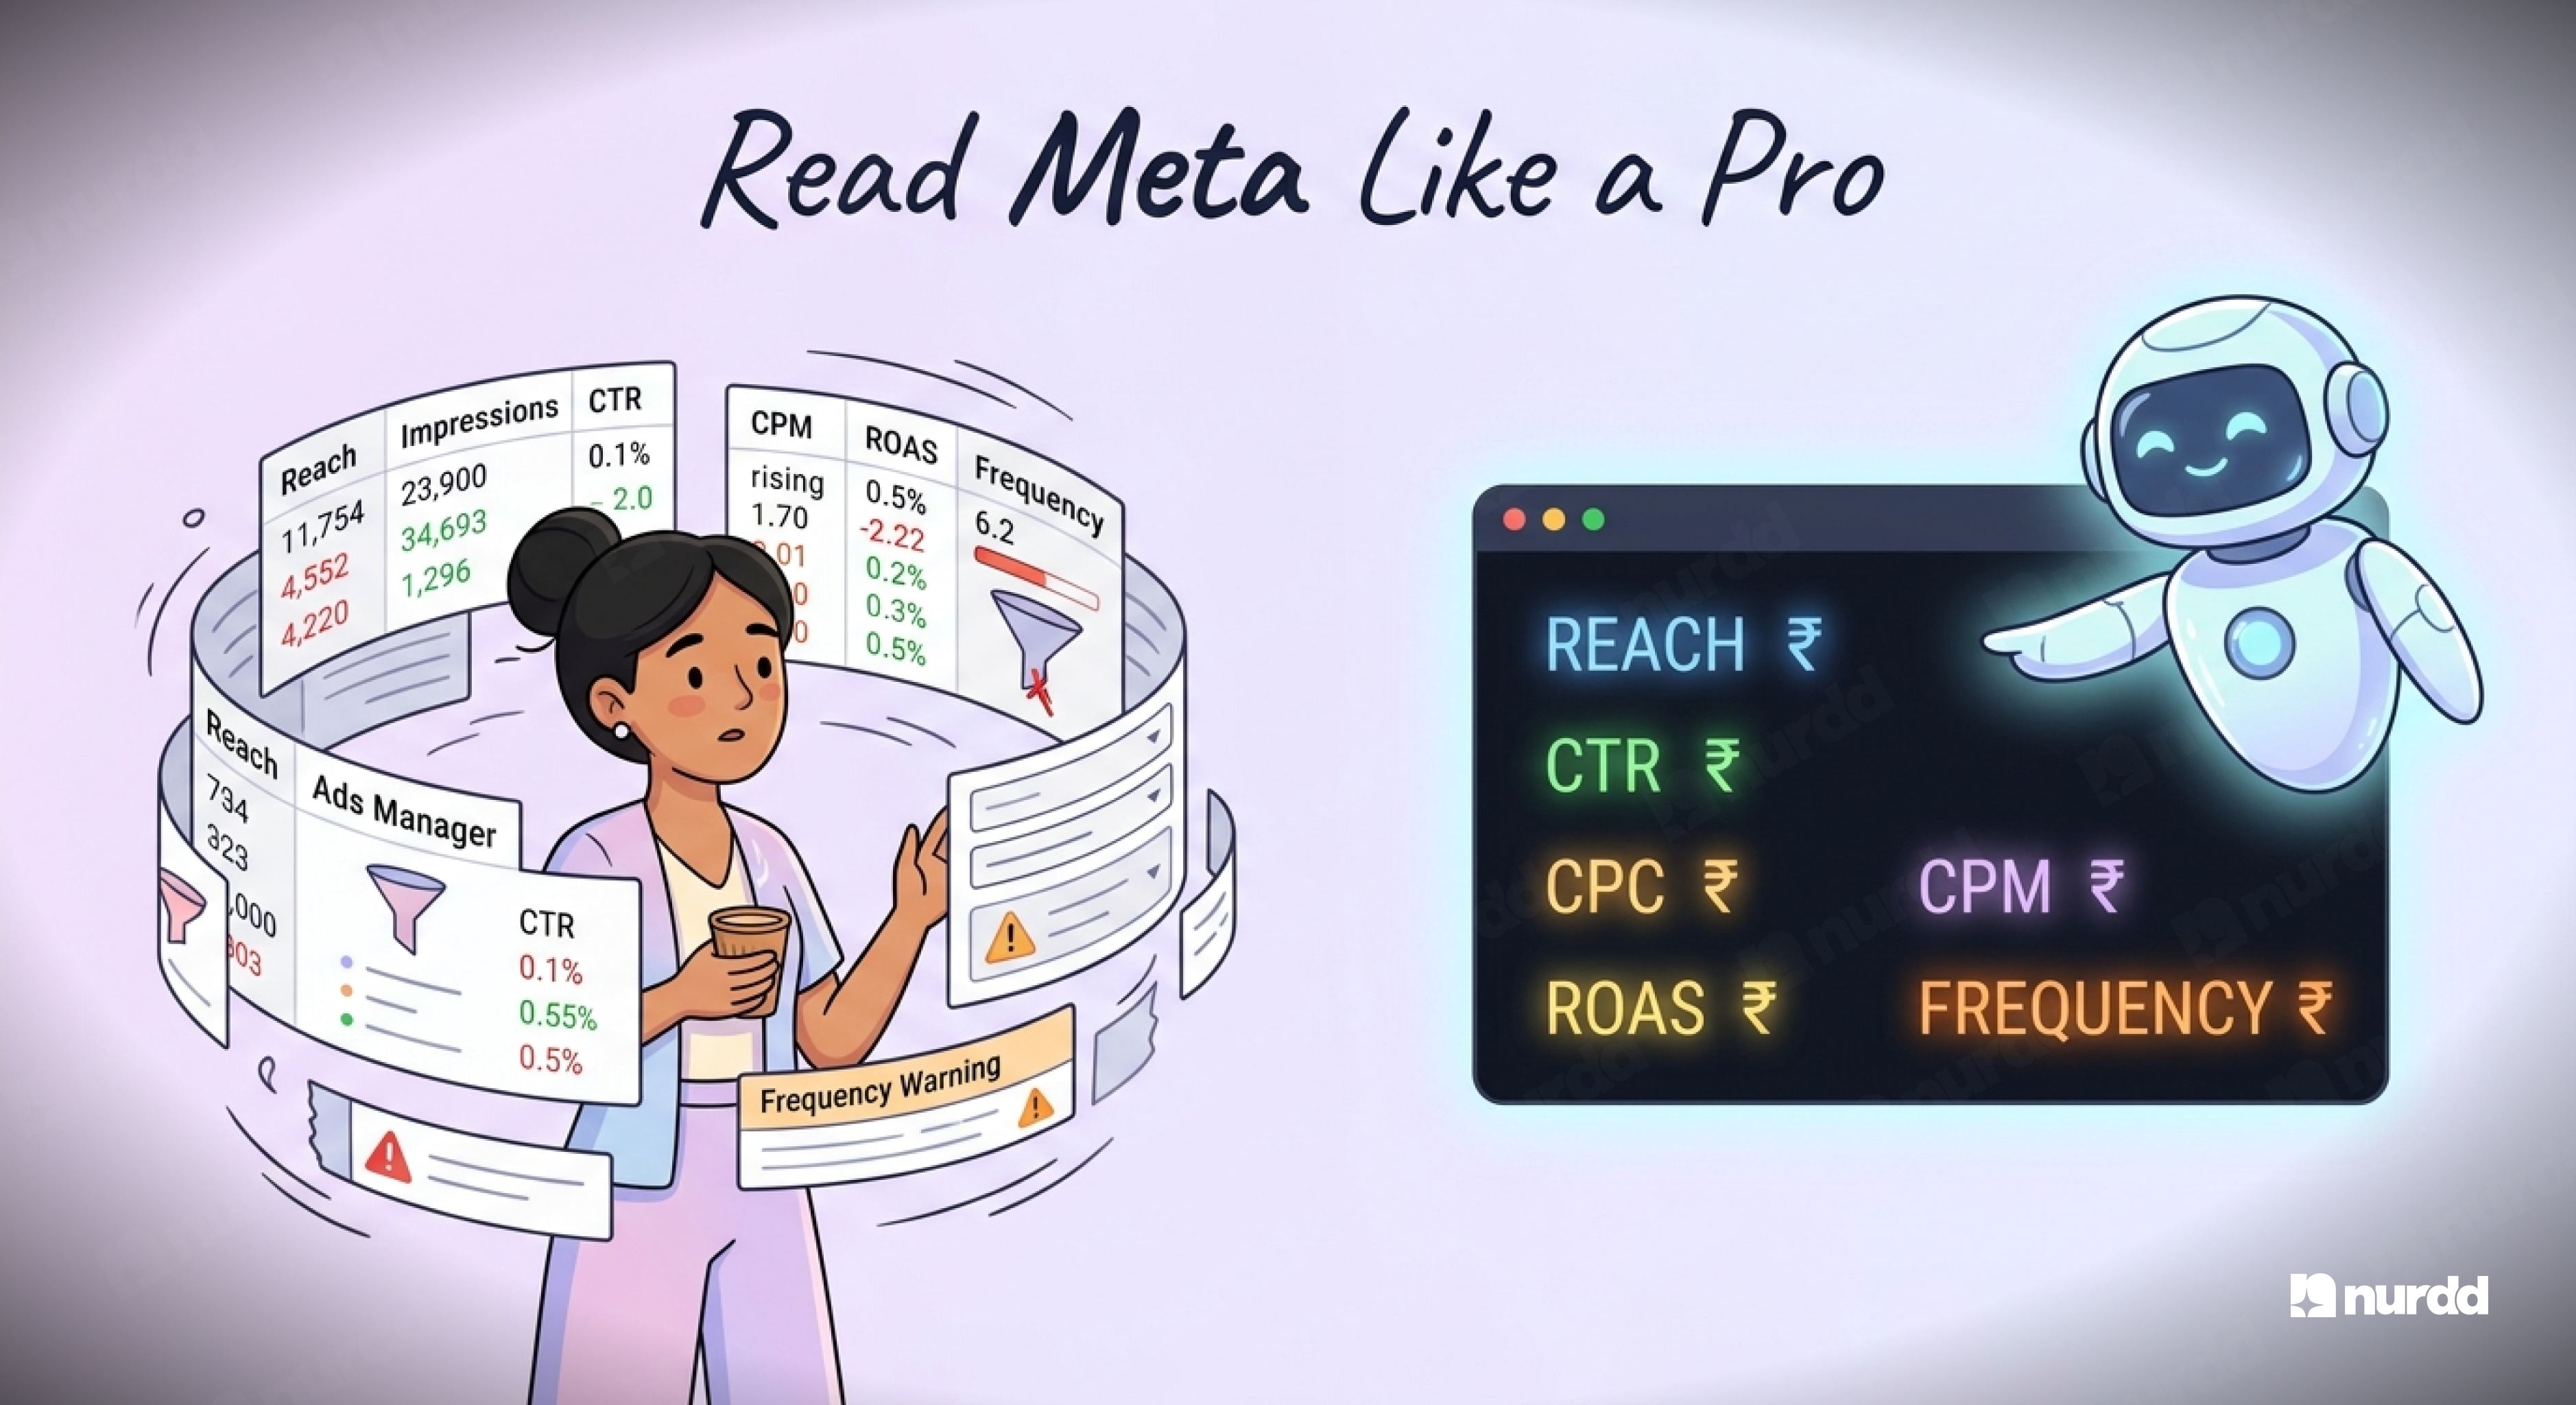
Meta Ads Manager was designed for performance marketers. The column density, the terminology, the breakdowns within breakdowns. It is a professional tool that assumes a professional user.
Most D2C brand founders and marketing managers are not that user. They are trying to run a brand, manage creators, and oversee multiple channels simultaneously. They need to look at their Meta reports and understand whether the campaigns are working, without having to hire an agency to translate.
This guide will teach you to read a Meta breakdown report correctly in 20 minutes or less.

The Three Layers of a Meta Breakdown Report
Every Meta Ads report has three layers of data. Understanding which layer you are looking at is the first step.
Layer 1: Campaign Level
This is the top level. It shows you how each campaign is performing in aggregate. If you have three campaigns, Awareness, Consideration, and Conversion, this level shows you the total spend, impressions, and results for each.
What to check at this level: Are you spending to plan? Is the cost per result within your target range? Which objective is delivering the most efficient results?
Layer 2: Ad Set Level
Each campaign contains multiple ad sets. Ad sets control your targeting, placement, budget, and schedule. This layer shows you how different audiences and placements are performing within a campaign.
What to check at this level: Which audiences have the best cost per result? Which placements are delivering results vs which are burning spend? Are any ad sets in the learning phase that may need more time?
Layer 3: Ad Level
Each ad set contains multiple ads. This layer shows you how individual creatives are performing. Same audience, different creative, different performance.
What to check at this level: Which creative has the best CTR? Which creative has the lowest CPC? Which creative is Meta's algorithm allocating the most spend to, and is that justified by its results?
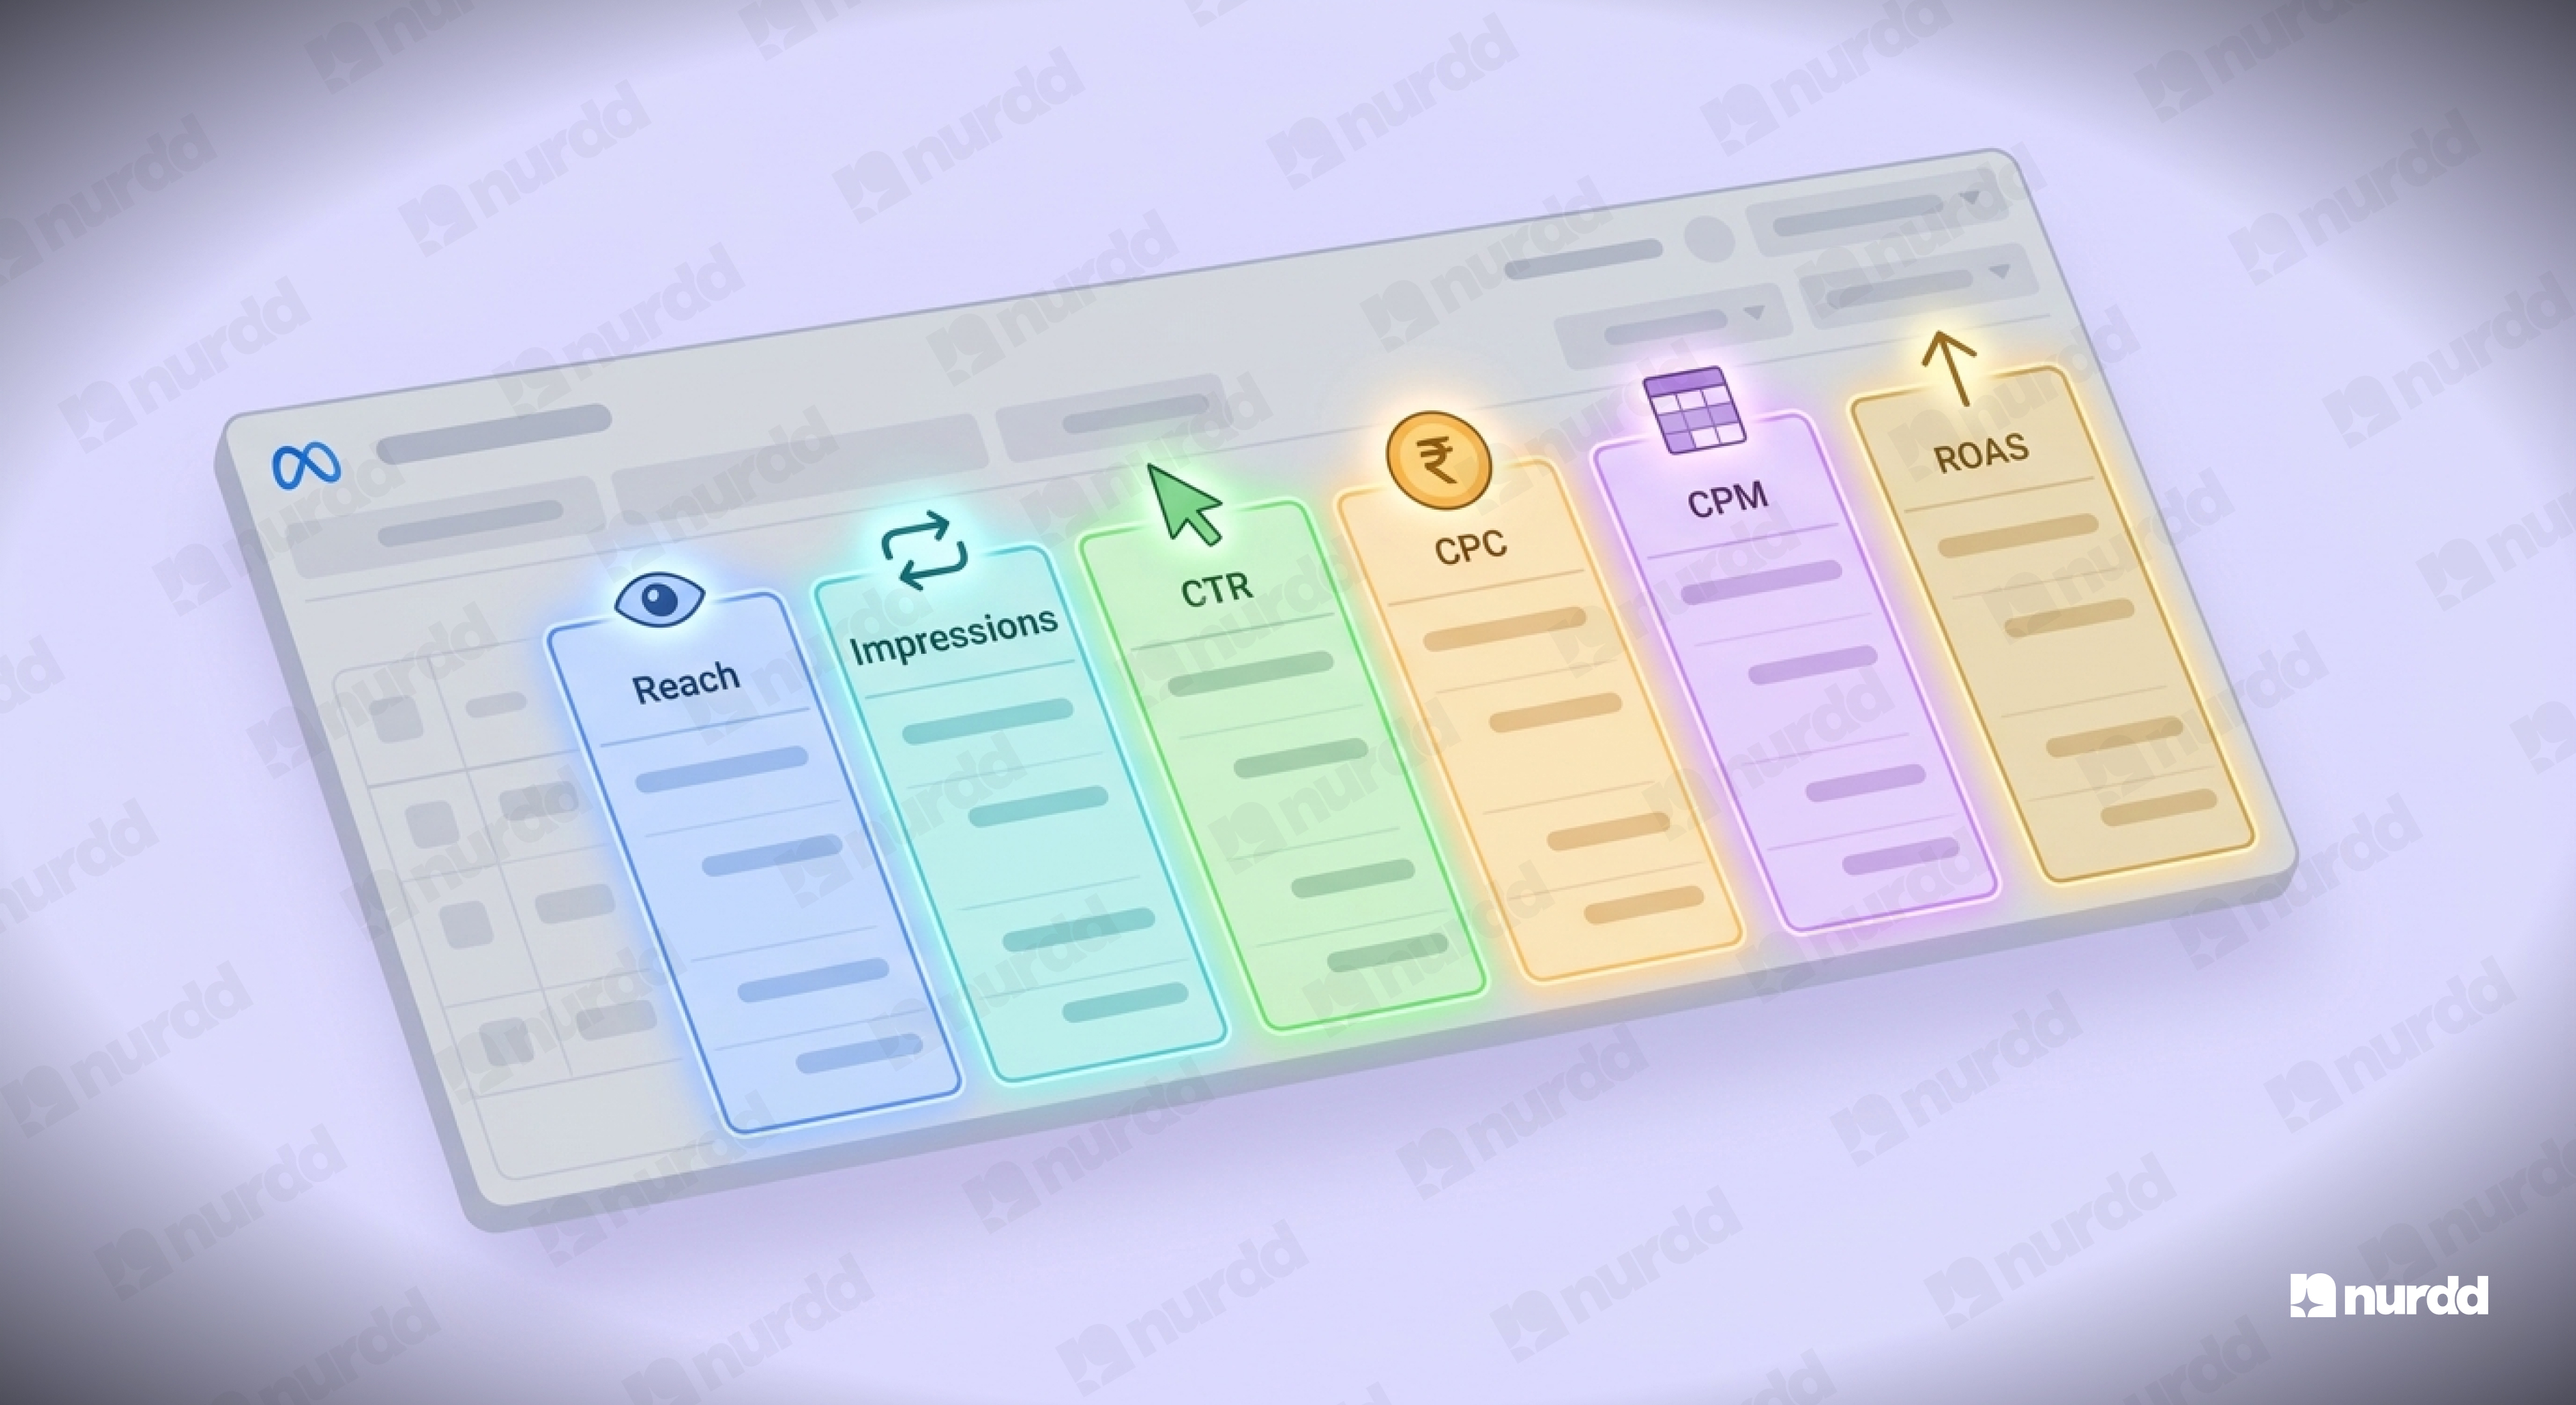
The Six Columns You Must Understand
Reach vs Impressions
Reach is the number of unique people who saw your ad. Impressions is the total number of times your ad was displayed, including multiple times to the same person.
Frequency (Impressions divided by Reach) tells you how many times the average person in your audience has seen your ad. A frequency above 4 on a cold audience means you are overexposing and will likely see CTR declining and CPM increasing.
CTR (Link Click-Through Rate)
The percentage of people who saw your ad and clicked the link to your website. For D2C brands, benchmark this against your category:
• Cold awareness audiences on Reels: 0.8 to 1.5 percent is strong
• Warm retargeting audiences: 2 to 5 percent
• Lookalike audiences: 1 to 2.5 percent
If your CTR is below 0.5 percent on a cold audience, the creative is not resonating. This is a creative problem, not a budget problem.
CPC (Cost Per Click)
How much you are paying per link click. High CTR plus high CPC can indicate an expensive audience. Low CPC plus low CTR can indicate Meta is showing your ad broadly to low-quality inventory.
CPC is most useful relative to your own historical baseline. A CPC of INR 18 means nothing in isolation. A CPC of INR 18 versus your previous campaign's INR 11 is a signal worth investigating.
CPM (Cost Per 1,000 Impressions)
How much you are paying to reach 1,000 people. CPM is driven by audience size, competition, placements, and ad quality score. Rising CPM across all your ad sets usually indicates increased auction competition in your category, often during festive periods or when new competitors enter the auction.
ROAS (Return on Ad Spend)
Revenue attributed to the campaign divided by ad spend. For D2C brands, purchase ROAS of 2 to 4 is typical depending on category. Below 1.5 usually means the campaign is not profitable after accounting for COGS.
Important caveat: Meta ROAS is based on view-through and click-through attribution using Meta's pixel. It is not the same as your actual business ROAS. Meta's number will typically be higher than your actual return because it counts some conversions that would have happened anyway.
Results and Cost Per Result
Results is the metric tied to your campaign objective. For conversion campaigns, this is purchases. For lead campaigns, this is leads. For traffic campaigns, this is link clicks.
Cost per result is your primary efficiency metric. Track it over time. A rising cost per result with stable ROAS indicates rising CPMs. A rising cost per result with falling ROAS indicates creative fatigue or audience saturation.
How to Use Breakdowns to Diagnose Campaign Problems
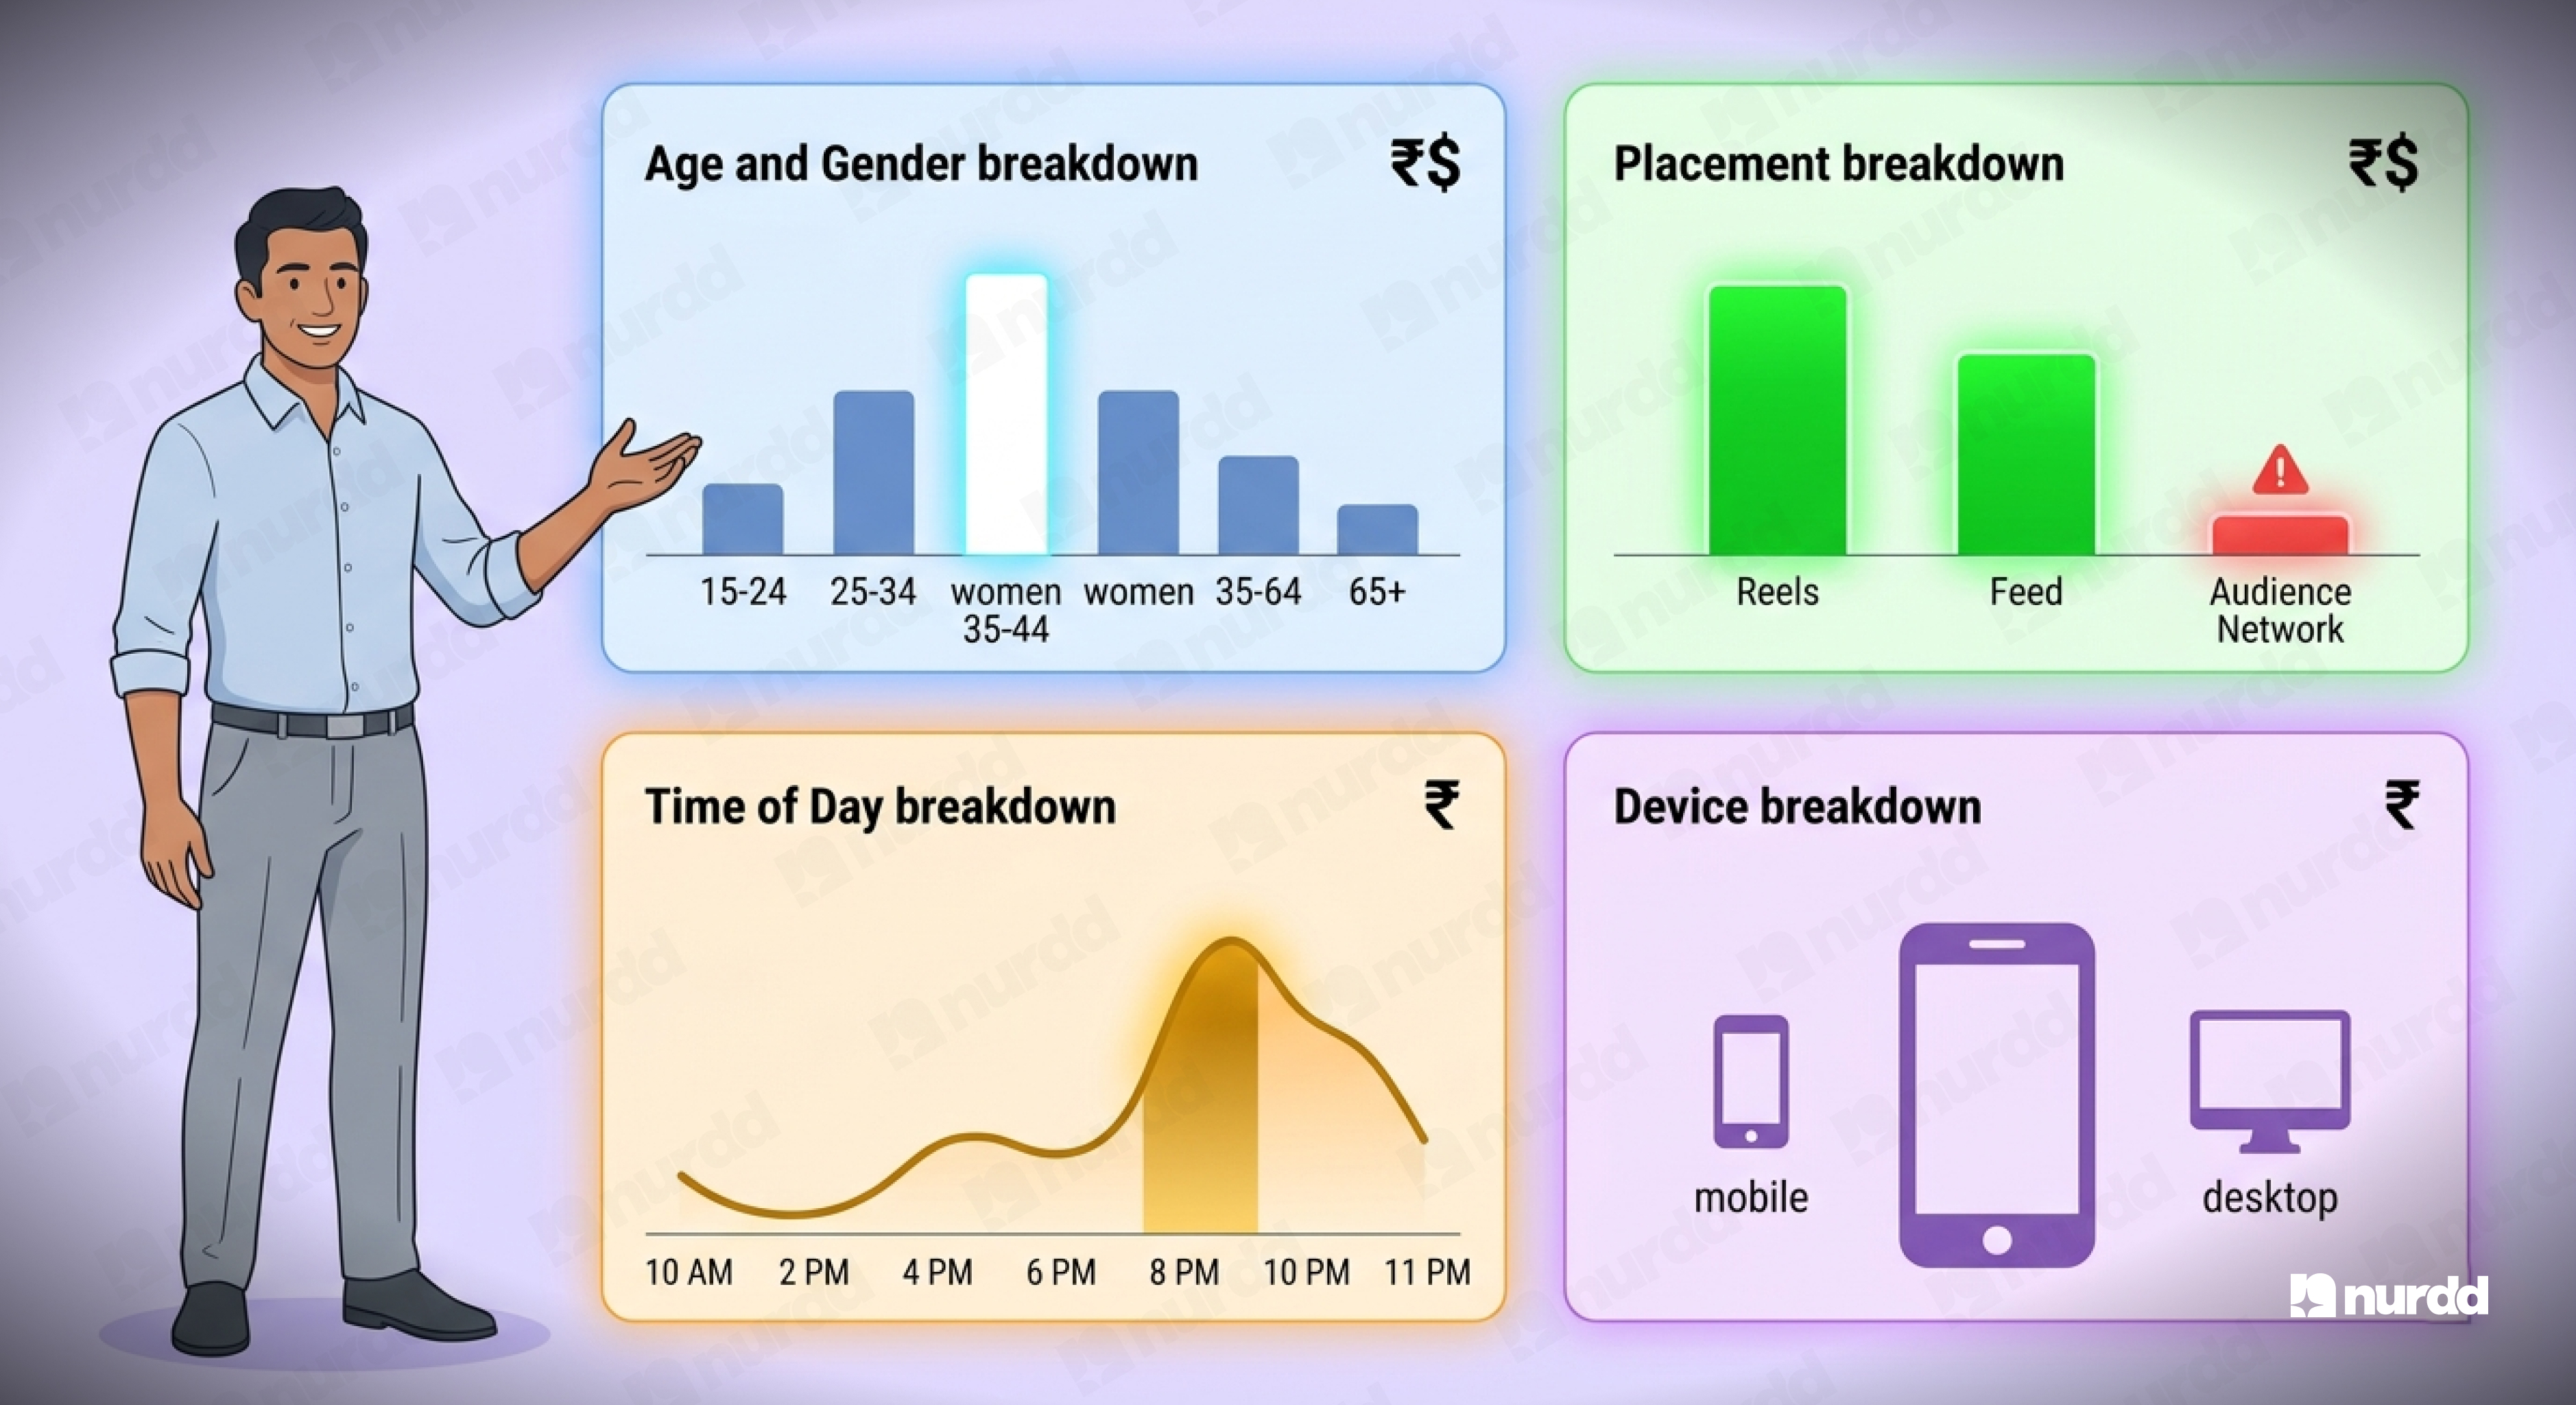
The Breakdown menu in Meta Ads Manager is where the real diagnostic work happens. Here are the four breakdowns you should check routinely:
Breakdown by Age and Gender
Who is actually converting? Often different from who you targeted. If you are targeting women 25 to 44 but 60 percent of your conversions are coming from women 35 to 44, narrow your targeting to improve efficiency.
Breakdown by Placement
Reels, Stories, Feed, Audience Network: each placement has different CPMs, CTRs, and conversion rates. Most D2C brands find that Reels and Feed are their highest-performing placements while Audience Network drives cheap impressions that rarely convert. If Audience Network is eating 20 percent of your spend, disable it.
Breakdown by Time of Day
When are your conversions happening? A significant portion of D2C conversions happen between 8 PM and 11 PM. If your budget is depleting early in the day on cheap impressions, you are not bidding effectively during peak conversion hours.
Breakdown by Device
Mobile vs desktop, iOS vs Android. If your landing page converts at 2 percent on mobile but 6 percent on desktop, and 80 percent of your traffic is mobile, your landing page optimization is more important than your bidding strategy.
You do not need to be a performance marketer to understand your Meta reports. You need to know which numbers matter, what direction they should be moving, and what each deviation tells you about your creative, audience, or account structure. That is all in this guide.
Sources and References
Meta Ads Manager Help (2025) – About Campaign Structure | facebook.com/business/help
Meta Business Help Center (2025) – About Ad Delivery Insights | facebook.com/business/help
Wordstream / LocaliQ (2025) – Facebook Ads Benchmarks 2025 | wordstream.com
Meta for Business (2025) – About Meta Pixel and Conversions API | facebook.com/business
Meta Ads Manager (2025) – Breakdowns in Ads Manager | facebook.com/business/help
AppsFlyer (2025) – Mobile Attribution India Report | appsflyer.com

Your ads are spending. Are they actually performing?
Pulse connects to Google Ads and Meta Ads to explain performance in plain language, diagnose what changed, and recommend specific actions — no data analyst needed.