Paid Media
Why Your Meta ROAS Looks Great on the Dashboard but Your Bank Account Disagrees
See why Meta’s attribution window inflates reported ROAS, how view-through credit distorts performance, and how to assess what your campaigns truly contribute.
 Simran Rawat3 May 20267 min read
Meta’s dashboard credits ads for purchases that may have come from organic traffic, email, repeat buyers, or other channels, especially through view-through attribution. This inflates reported ROAS, so compare it with total revenue, test incrementality, and track profit and new-customer acquisition instead.
A brand does $2,500 in Meta Ads spend in a month. The Meta dashboard reports $11,250 in revenue attributed to those ads. A 4.5x ROAS. Leadership is happy. Budget gets increased.
Then the CFO runs the numbers. Total revenue for the month is $13,400. Meta is claiming credit for 84% of it. But the brand also has organic traffic, email campaigns, repeat buyers, and a seasonal tailwind. Something does not add up.
This is not a unique situation. It is the dominant reality of Meta advertising measurement, and the brands that do not understand why it happens are making budget decisions based on numbers that are systematically misleading.

The attribution model is the source of most of the inflation
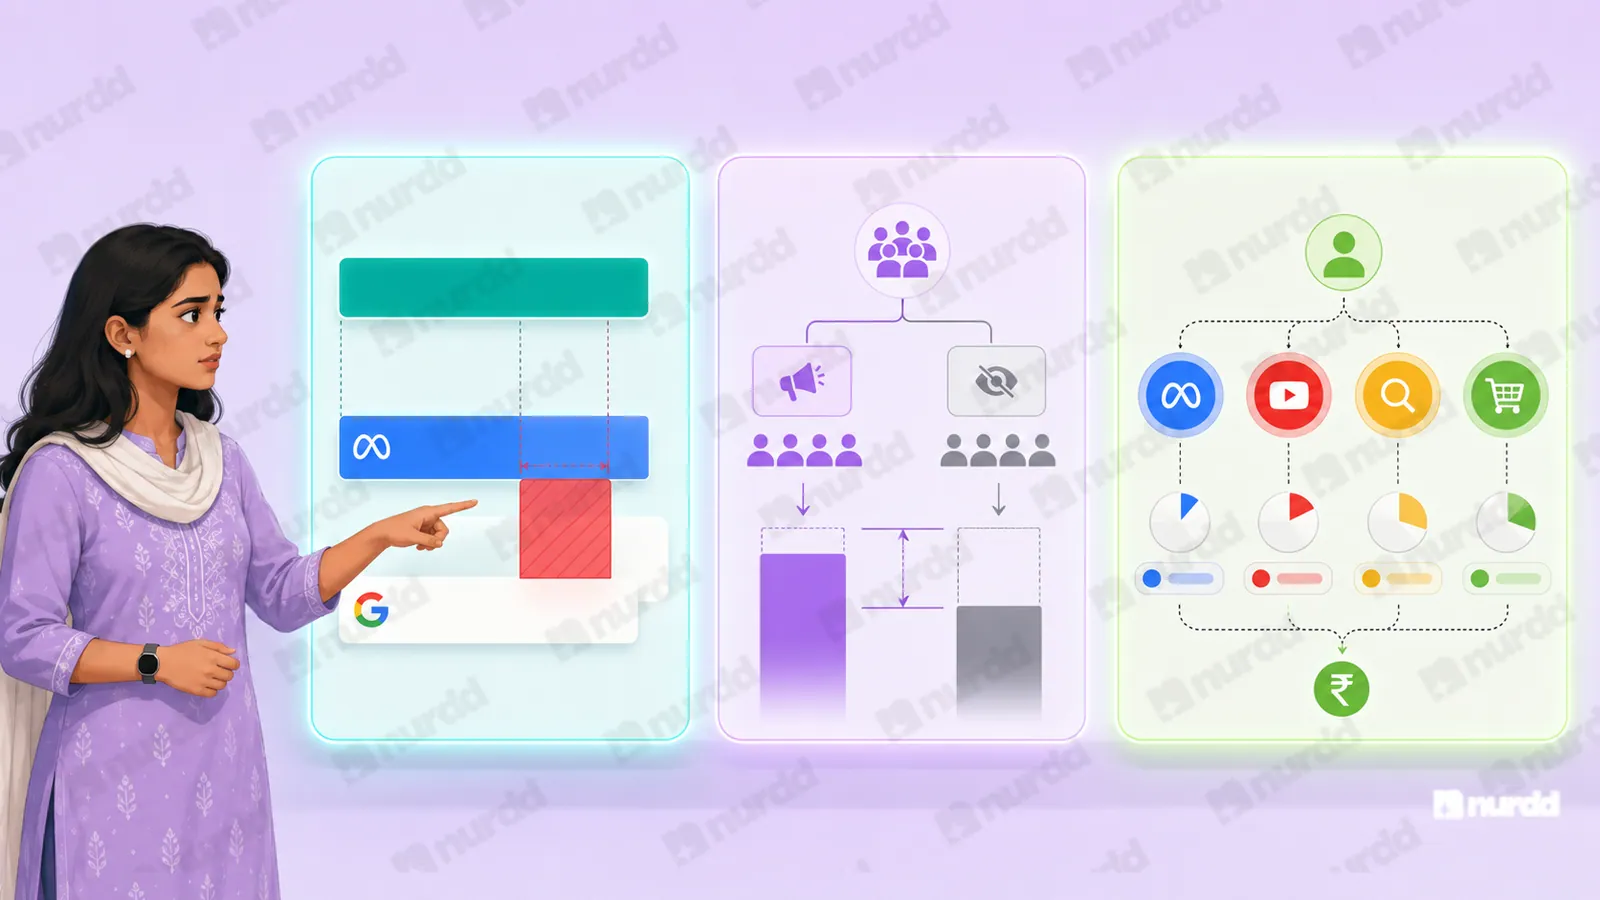
Meta's default attribution window attributes a purchase to an ad if the buyer clicked on that ad within 7 days of the purchase, or viewed the ad within 1 day of the purchase. The view-through attribution is the primary source of inflation.
Consider what view-through attribution captures: a user who scrolled past your ad without clicking, continued scrolling, and then went to your website later to buy something. Meta claims that sale. In many cases, that user was going to buy anyway. They are an existing customer, a direct-traffic visitor, or a buyer responding to a non-Meta touchpoint that has been entirely erased from the attribution picture.
The result is that Meta's reported ROAS systematically overstates the contribution of Meta ads to overall revenue, often by 40% to 70% for brands with mature organic channels.
How to triangulate what is actually happening
The most reliable way to check your Meta attribution is to compare it against your platform revenue. Take your total revenue for the period. Subtract what Meta is claiming. Subtract what Google Ads is claiming. In almost every case for brands running both channels, the sum of claimed revenue from both ad platforms exceeds total actual revenue. The overlap is the double-counting.
A second method is incrementality testing. Pause Meta ads for a defined group of your audience for a week while running normally for a control group. Measure the revenue difference. The actual incremental revenue driven by Meta is the gap.
A third method is multi-touch attribution modelling, which assigns credit across touchpoints proportionally. This gives a far more honest picture of how each channel contributes to the purchase journey.
The dangerous decisions that come from trusting reported ROAS
When brands trust inflated ROAS numbers without scrutiny, they over-invest in paid media at the expense of organic and retention. They reduce email marketing spend because "Meta is performing better." They cut creator campaigns because the attribution model cannot capture their contribution.
The most expensive version of this plays out when brands scale aggressively based on strong dashboard ROAS, then reduce spend due to budget pressure and watch revenue drop less than expected. The realisation that Meta was claiming credit for sales that would have happened anyway is painful at that scale.
The metric to use instead
POAS, or profit on ad spend, is a more honest north star than ROAS because it forces you to account for the actual margin impact of your ad spend rather than the gross revenue a platform claims to drive.
Beyond that, track new customer acquisition rate as a percentage of Meta-attributed conversions. If Meta is showing a 4.5x ROAS but 60% of attributed purchases are from existing customers who were going to buy regardless, the actual new customer acquisition efficiency of your spend is far weaker than the headline number suggests.
The dashboard ROAS is not lying exactly. It is just speaking a language that does not translate directly into business outcomes. The translation work is on you.
A ROAS number that makes everyone in the room feel good is often the most expensive number in the business.

Sources & References
1. Meta Business Help Center: Attribution Windows Explained - https://www.facebook.com/business/help/2198119873776795
2. Measured.com: Meta Attribution Inflation Research 2024 - https://measured.com/blog/facebook-attribution/
3. Northbeam: Multi-Touch Attribution for D2C Brands - https://www.northbeam.io/blog/multi-touch-attribution
4. Triple Whale: ROAS vs POAS Framework - https://www.triplewhale.com/blog/poas-vs-roas