

Three metrics. Three different stories about the same marketing spend. ROAS makes your ads look efficient. MER shows whether your whole marketing programme is productive. Contribution margin tells you whether the revenue you generated actually made you money.

Side-by-Side Comparison
What Each Metric Does — and Does Not — Tell You
Metric | Formula | What It Answers | Where It Lies | Best Used For |
|---|---|---|---|---|
ROAS | Ad-attributed revenue ÷ Ad spend | How efficient is this specific ad campaign on this platform? | Includes repeat buyers who were already going to purchase. Varies by attribution window. Platform can show 4.1x on 7-day view and 2.3x on 1-day click. | Comparing campaigns against each other on the same platform with the same attribution window only |
MER | Total Shopify revenue ÷ Total marketing spend (all channels) | How efficiently is my entire marketing programme producing revenue? | Does not tell you which channel is driving the efficiency. A rising MER could be Meta improving or your email list maturing. | Week-over-week and month-over-month business-level performance tracking |
Contribution Margin | Revenue − COGS − variable costs (shipping, returns, payment processing) | Did this revenue actually make me money? | Does not account for fixed costs or marketing spend. Needs to be viewed alongside ROAS to be complete. | Setting ROAS targets per product SKU based on actual margin profile |
The System That Works
How to Use All Three Together
Step 1: Use contribution margin to set ROAS targets per product SKU. A product with 25% gross margin needs a minimum ROAS of 4.0x to be profitable on paid acquisition. A product with 65% gross margin is profitable at 1.54x ROAS. Set different targets for different SKUs, not one blended target for the whole catalogue.
Step 2: Use MER as your weekly business-level efficiency indicator. If MER is rising week-over-week, the overall marketing programme is becoming more efficient. If it is falling, investigate which channels and channels are underperforming.
Step 3: Use ROAS for intra-platform campaign comparison only comparing Meta campaign A against Meta campaign B, or Google Shopping against Google Search within the same account. Never use ROAS to compare Meta against Google.

Setting the Right ROAS Target Per SKU
The Formula Every D2C Brand Needs
The single most common ROAS management error in Indian D2C: one blended ROAS target for the entire product catalogue, regardless of the margin difference between SKUs.
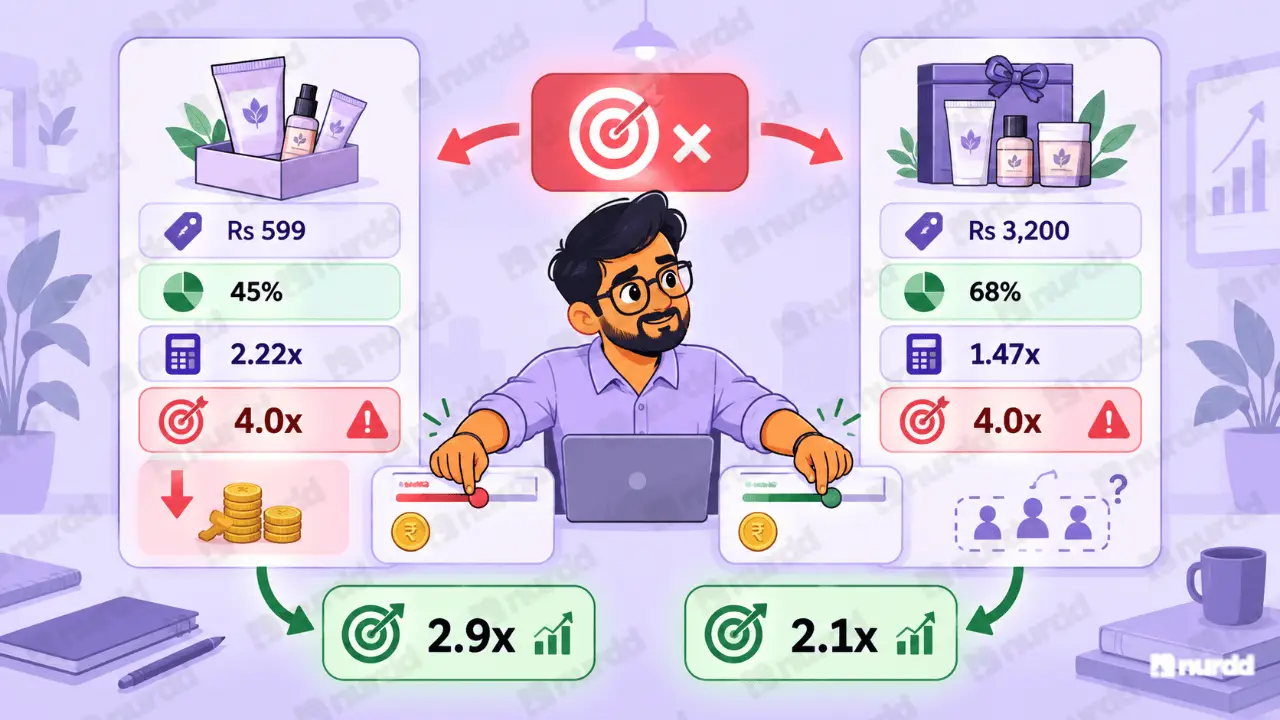
A starter kit at Rs 599 with 45% gross margin and a premium bundle at Rs 3,200 with 68% gross margin cannot have the same ROAS target. The premium bundle can be profitably acquired at a significantly lower ROAS which means if you set a uniform target, you are systematically over-bidding for starter kit buyers and under-investing in premium bundle acquisition.
Minimum profitable ROAS by contribution margin:
30% contribution margin- minimum profitable ROAS is 3.33x
40%- minimum is 2.5x
50%- minimum is 2.0x
60%- minimum is 1.67x
Set these targets as your break-even ROAS per product group. Your actual target should be 1.3 to 1.5x above break-even to cover fixed costs and provide a margin for variability. Build separate ad groups or campaigns per product tier and bid according to the margin of the SKU being promoted, not the account average.
"ROAS is the metric platforms give you because it makes them look good. MER and contribution margin are the metrics you choose because they tell you the truth."
Sources and References
Triple Whale – MER vs ROAS: ecommerce attribution resources
Shopify Blog – Understanding contribution margin for ecommerce
Northbeam – Marketing efficiency ratio and attribution resources
Nurdd / Pulse – Marketing metric framework resources for Indian D2C brands

Your ads are spending. Are they actually performing?
Pulse connects to Google Ads and Meta Ads to explain performance in plain language, diagnose what changed, and recommend specific actions — no data analyst needed.