How to Normalise Meta and Google Ads Data So You Can Finally Compare Them Fairly
 8 Sept 20267 min read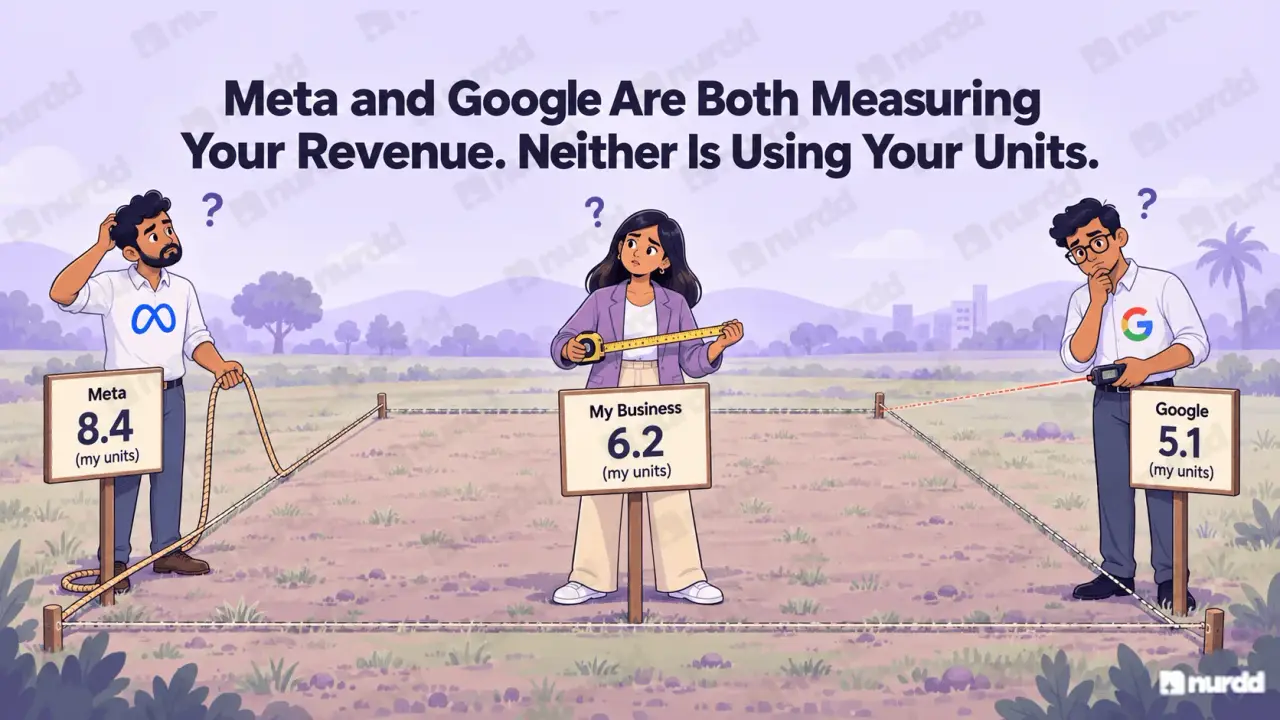
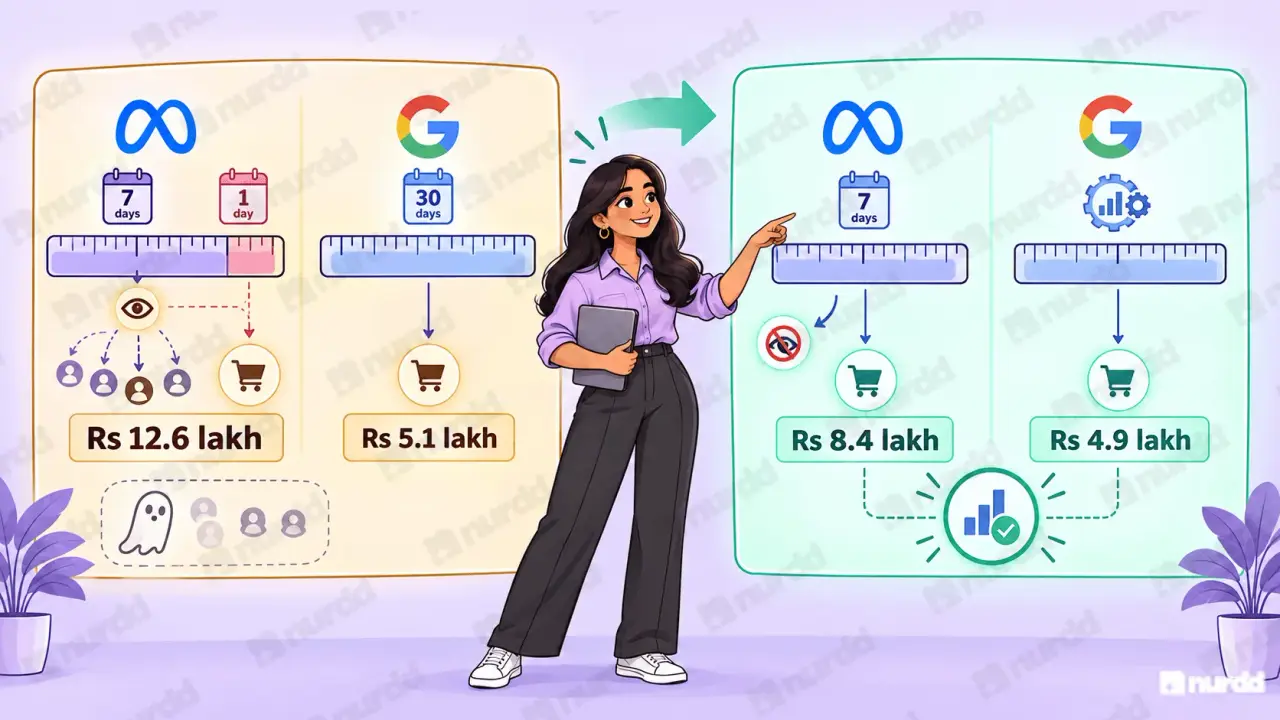
Set both platforms to the same attribution window before comparing anything. Meta defaults to 7-day click plus 1-day view and counts view-through conversions; Google defaults to last click over 30 days and does not. Most of the gap between their reported revenue is the settings, not performance.
Meta shows Rs 8.4 lakh in attributed revenue. Google shows Rs 5.1 lakh. Shopify shows Rs 6.2 lakh total. These numbers do not add up because they are not measuring the same thing. Here is how to normalise the data so the comparison is valid.

Why the Raw Numbers Are Incomparable
The Attribution Problem Explained
Platform | Default Attribution | Window Length | Includes View-Through? | Bias Direction |
|---|---|---|---|---|
Meta Ads | 7-day click + 1-day view | 7 days | ✅ Yes | Overstates revenue |
Google Ads | Last click (default) | 30 days | ❌ No | Overstates for long cycles |
Shopify | Last-click session | Session only | ❌ No | Understates assisted conversions |
The gap is not theoretical. Here is a real example of what the same campaign looks like across all three:
Attributed Revenue for the Same Campaign — Three Sources
Meta and Google together claim Rs 13.5 lakh. Shopify recorded Rs 6.2 lakh. The gap Rs 7.3 lakh is double-counted attribution. Budget allocation decisions made from platform-reported numbers are systematically wrong.
Treating these three as comparable without normalisation produces false conclusions about which channel is performing better. That is where most budget allocation mistakes originate.
Step 1
Align Attribution Windows Across Both Platforms
In Meta Ads Manager:
Go to the Columns menu in your campaign view
Select Customise Columns, then Attribution Setting
Change from 7-day click plus 1-day view to 7-day click only
Your reported Meta revenue will drop. This is not a performance drop it is inflation removal. The new number is more accurate.
In Google Ads:
Go to Tools, then Attribution
Switch to Data-Driven attribution (requires 50 or more conversions per month) or Linear if volume is lower
Now both platforms use click-only attribution with comparable windows and similar multi-touch logic. The comparison is valid.
Step 2
Exclude Branded Traffic From Both Channels
Branded search and retargeting ROAS are structurally higher because the buyers in those campaigns already have intent created by other channels. Comparing Meta ROAS to Google ROAS at account level blends prospecting vs retargeting vs branded in ways that make a fair comparison impossible.
In Google: Create a separate campaign or label for branded keywords. Report branded search ROAS separately from non-branded category search ROAS.
In Meta: Separate prospecting campaigns (broad, lookalike, interest-based) from retargeting campaigns (website visitors, cart abandoners). Report each separately.
Compare only prospecting campaign ROAS between Meta and Google. This is the only fair comparison of each platform's ability to create new demand from audiences that do not already know your brand.
Step 3
Cross-Reference Against Shopify as Ground Truth
Pull your Shopify revenue report filtered by UTM source = paid-social for Meta traffic and paid-search for Google traffic.
The gap between your Shopify-observed number and your normalised platform-reported number is your remaining attribution gap. For most Indian D2C brands, even after normalisation, Meta reports 25 to 45% more revenue than Shopify attributes to it.
This is not a data error. It represents real purchases that Meta influenced but did not receive last-click credit for in Shopify — genuinely assisted conversions that the platform's model captures but Shopify's last-click reporting misses. Neither number is wrong. They are measuring different things and both have legitimate uses in different decisions.
Handling Legacy Data
What to Do When You Change Attribution Settings
If you are normalising your Meta and Google attribution settings for the first time, your historical data used different settings and is not directly comparable to your new normalised reports.
Document the methodology change with an exact date. Mark all reports before that date as legacy attribution. When doing quarter-on-quarter comparisons, only compare periods that used the same attribution methodology.
Before changing attribution settings on your live account, export a month of performance data using the old settings as your final legacy baseline. This baseline the last month of old-methodology data alongside your first month of new-methodology data makes the impact of the change visible and prevents future confusion about whether performance changed or whether the measurement changed.
"Comparing Meta and Google on default settings is like comparing two rulers made in different units. Normalise first. Then compare."

Sources and References
Meta Business Help – About attribution settings in Ads Manager
Google Ads Help – About attribution models
Shopify Help – Understanding traffic sources in reports
Nurdd / Pulse – Cross-channel paid media normalisation resources

Your ads are spending. Are they actually performing?
Pulse connects to Google Ads and Meta Ads to explain performance in plain language, diagnose what changed, and recommend specific actions — no data analyst needed.