

Measure every channel in one system rather than three, because siloed reporting counts the same customer repeatedly. A buyer who saw a creator post, was retargeted on Meta and converted through branded search is claimed by all three platforms, so total attributed revenue can exceed what the business actually earned.
Most Indian D2C brands measure their marketing in silos. The influencer team reports engagement. The performance team reports ROAS. The content team reports traffic. Nobody is looking at how all three interact — or what the true cost of acquiring a customer actually is.

Why Siloed Measurement Fails
The Triple-Counting Problem
A customer who discovered you through a creator's Instagram post on Monday, was retargeted by a Meta ad on Wednesday, and purchased through a Google branded search on Friday gets counted as a conversion by all three systems simultaneously.
Total attributed revenue across all three: three times the actual revenue.
Each channel looks profitable in isolation. The brand looks like it is growing fast. But the budget allocation decisions made from these numbers are systematically wrong — because you cannot identify which channels are genuinely driving incremental revenue versus which are claiming credit for purchases that would have happened anyway.
Layer 1
The Single Source of Truth: Your Shopify Revenue
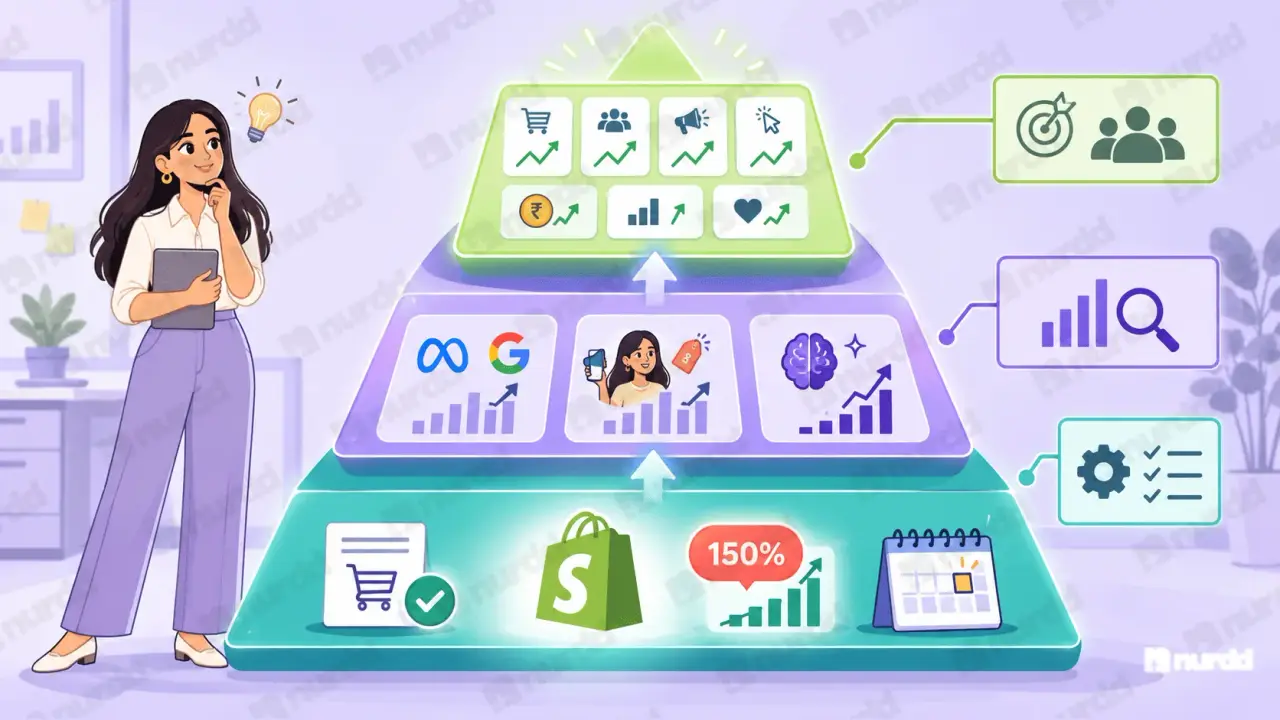
Every measurement framework for a D2C brand starts with one number: total Shopify revenue for the period. This is your ground truth. Not attributed to any channel. Not inflated by any platform's attribution model.
On the first business day of every month, pull total Shopify revenue and make it the visible anchor number in your reporting. Every other number is relative to this anchor.
A practical rule: If the sum of attributed revenue across all channels exceeds 150% of Shopify revenue, you have significant double-counting creating false confidence in one or more channels.
Layer 2
Channel-Level Attribution With Consistent Methodology
For paid media: Use 7-day click only, branded search excluded. This is what Pulse produces. The normalised ROAS number is comparable across Meta and Google and provides a consistent signal for channel allocation decisions.
For influencer marketing: Use UTM conversions plus promo code redemptions. This is what Nia produces. Cost per sale per creator produced from dual-signal attribution is the metric that drives renewal decisions and budget scaling for individual partnerships.
For organic and AI search: Use GA4 organic conversion reports to understand traffic volume and conversion rate. Layer Noma's AI visibility score on top to understand the upstream driver of organic discovery. A rising AI visibility score is a leading indicator it predicts improved organic discovery traffic 4 to 8 weeks before the traffic uplift shows up in GA4.
Layer 3
The Seven-Metric Unified Dashboard
Seven numbers, tracked weekly, with week-on-week trend for each:
Total Shopify revenue — the ground truth
Total marketing spend — paid media, creator fees, agency, platform subscriptions, prorated headcount
Blended ROAS — total Shopify revenue ÷ total marketing spend
New customer count from Shopify Analytics
Cost per new customer — total spend ÷ new customer count
Channel contribution percentage — what share of Shopify revenue each channel attributes to itself
Week-on-week trend for each of the above six metrics
The channel contribution percentages will sum to more than 100% — this is multi-channel attribution overlap, not a data error. Tracking this overlap percentage over time tells you whether channels are becoming more or less interdependent in driving your buyers.
Implementation Timeline
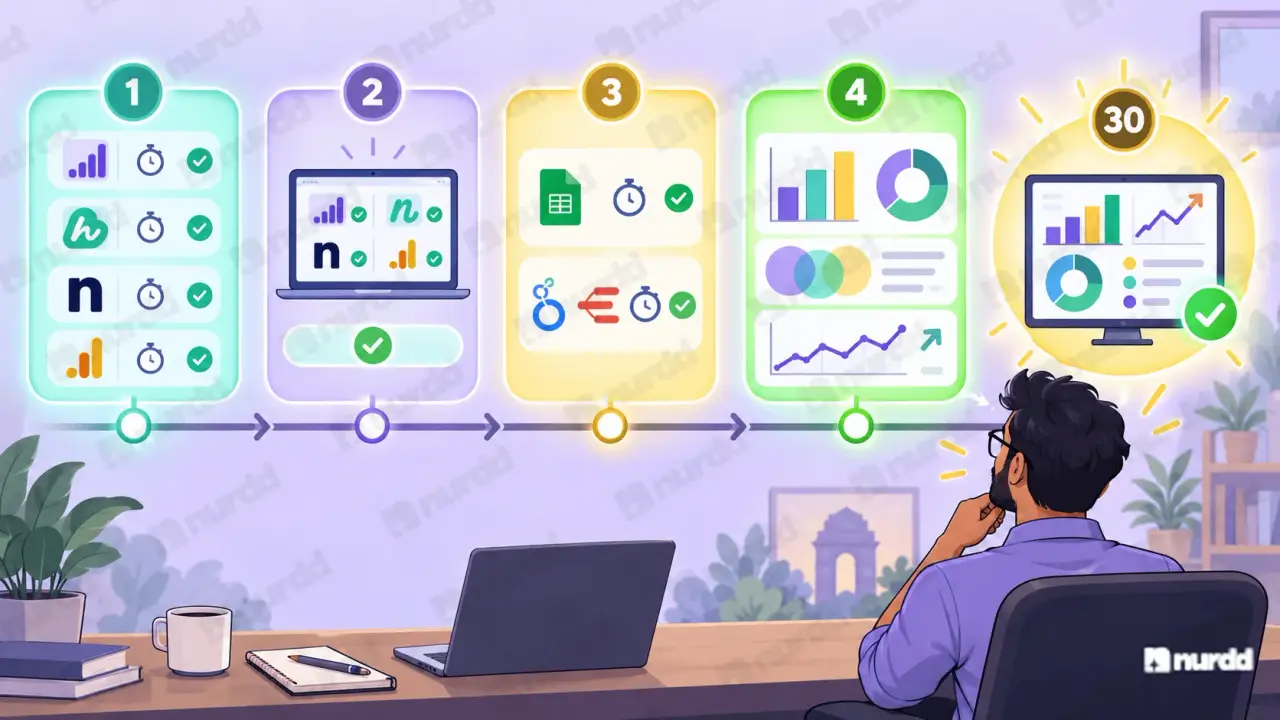
How to Build This System in 30 Days
Wk 1
Data Infrastructure
Connect Pulse, Nia, Noma, GA4. Each connection: 2–4 hrs setup.
Wk 2
Baseline Measurement
Let all four systems run. Confirm each is tracking correctly before acting on data.
Wk 3
Dashboard Build
Google Sheets: 2 hrs. Looker Studio with Supermetrics: 4–6 hrs.
Wk 4
First Decision Cycle
Compare blended ROAS to channel attribution totals. Quantify double-counting. Note AI visibility trend.
"Measuring channels in silos does not tell you how your marketing works. It tells you how each channel appears to work when it takes credit for everything it touched."
Sources and References
Shopify Help – Analytics and reports overview
Google Analytics Help – About attribution in Google Analytics
Google Looker Studio – Connect, visualise, and share your data