

Attribution tells you which creator link a buyer clicked; incrementality tells you whether that buyer would have purchased anyway. Run a geo or audience holdout, compare converted volume against the control group, and count only the difference as revenue the creator actually caused.
Attribution tells you which influencer's link a buyer clicked before purchasing. Incrementality testing tells you whether those buyers would have purchased anyway without the influencer campaign. These are entirely different questions — and the second is the more important one.

The Difference That Matters
Attribution vs Incrementality
Attribution: Which influencer's link did the buyer click before purchasing?
Incrementality: Would those buyers have purchased anyway without the influencer campaign?
A brand with strong organic search presence, an existing email list, and repeat customer behaviour is particularly vulnerable to false attribution in influencer marketing. A buyer who was going to repurchase anyway and happened to click a creator's link in the week before their repeat purchase produces an attributed conversion that is not an incremental one.
Incrementality does not mean the influencer programme is worthless. It means you need to know the difference between conversions your programme created and conversions your programme simply intercepted.
Method 1
The Ghost Bid Test (Holdout Test)
Split your target audience into two equal groups: an exposed group who sees the campaign, and a holdout group who does not. After the campaign period, compare the conversion rate of both groups. The difference is your incremental lift.
For influencer campaigns, a pure holdout test is difficult because you cannot control who sees a creator's organic post. You can approximate it with a promo code test:
Give the creator a code to promote
Compare the purchase rate of people exposed to the content (estimated via reach) against your baseline purchase rate from non-creator traffic sources for the same period
If your baseline conversion rate is 1.8% and your creator audience converts at 2.6%, your incremental lift is approximately 44% of the creator-attributed sales. The remaining 56% may have converted through other channels regardless.
Method 2
Before-and-After Analysis
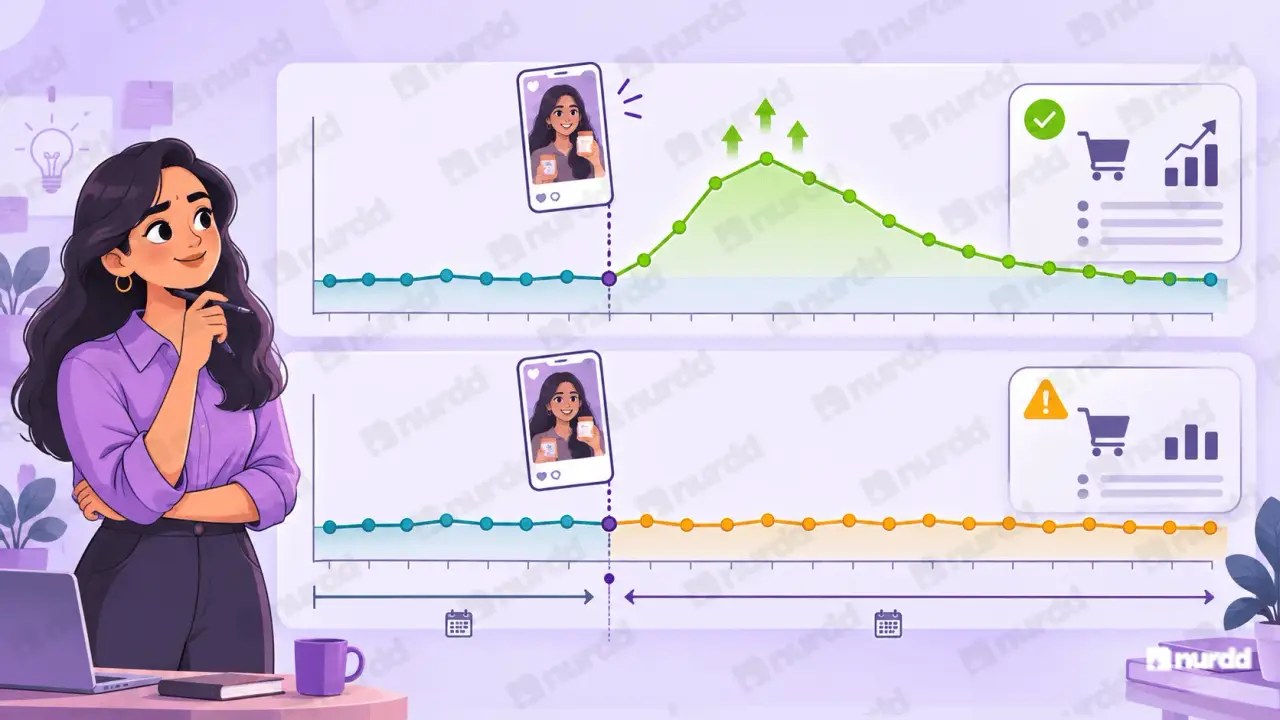
If a holdout test is logistically complex, a before-and-after analysis provides directional incrementality data.
Track your daily order volume for 14 days before a creator campaign.
Track it for 14 days after.
Control for known external factors seasonality, sale events, email campaigns running simultaneously.
A genuine incremental lift from an influencer campaign typically shows as a spike of 20 to 50% above baseline in the 48 to 72 hours after a creator posts, followed by a gradual return to baseline.
If you see no spike and sales track exactly as they would have without the campaign, the campaign may have high attribution but low incrementality.
What to Do With the Data
How Incrementality Changes Your Creator Budget Decisions
High incrementality (measurable lift above baseline): Deserves a larger share of your creator budget. This creator is genuinely creating demand.
Strong attribution, no measurable baseline lift: Evaluate at lower investment or test with a stronger call-to-action before scaling. You may be paying for credit on sales that were already happening.
Nia's 48-hour order volume analysis after each creator's live date provides a directional incrementality indicator without requiring a formal holdout test giving brands a practical proxy for true causal lift from each campaign.
Building It Into Your Workflow
Making Incrementality Testing a Routine, Not a One-Off
Most brands run one incrementality test, find the results interesting, and then never run one again. The value of incrementality testing compounds when it is repeated consistently — because you are building a proprietary dataset of which creators, which formats, and which audience segments consistently produce true incremental lift for your specific brand.
After 6 months of consistent before-and-after analysis per creator campaign, you have enough data to identify which creator tier, which content format, and which posting cadence produces the highest incremental lift for your brand — independent of what any attribution report says. This is a dataset your competitors cannot buy or replicate, because it is specific to your brand, your audience, and your products.
Practical implementation:
Record baseline daily order volume for every 14-day window before every creator campaign
Record 48-hour and 7-day lift above baseline after each creator's posting date
One row per creator per campaign in your incrementality tracking sheet
Review quarterly for patterns by tier, format, and category
"Attribution tells you who was near the sale. Incrementality tells you who caused it. These are not the same creator."

Sources and References
Northbeam – Incrementality testing for ecommerce marketing
Meta for Business – About conversion lift studies
Google Ads Help – About conversion lift experiments
Nurdd / Nia – Influencer incrementality resources for Indian D2C brands

Find the right creators — and verify they're real.
Nia gives brands access to 10M+ Indian creator profiles, TruAI fake follower detection, pre-spend ROI forecasting, and product-level sales attribution. Completely free.