
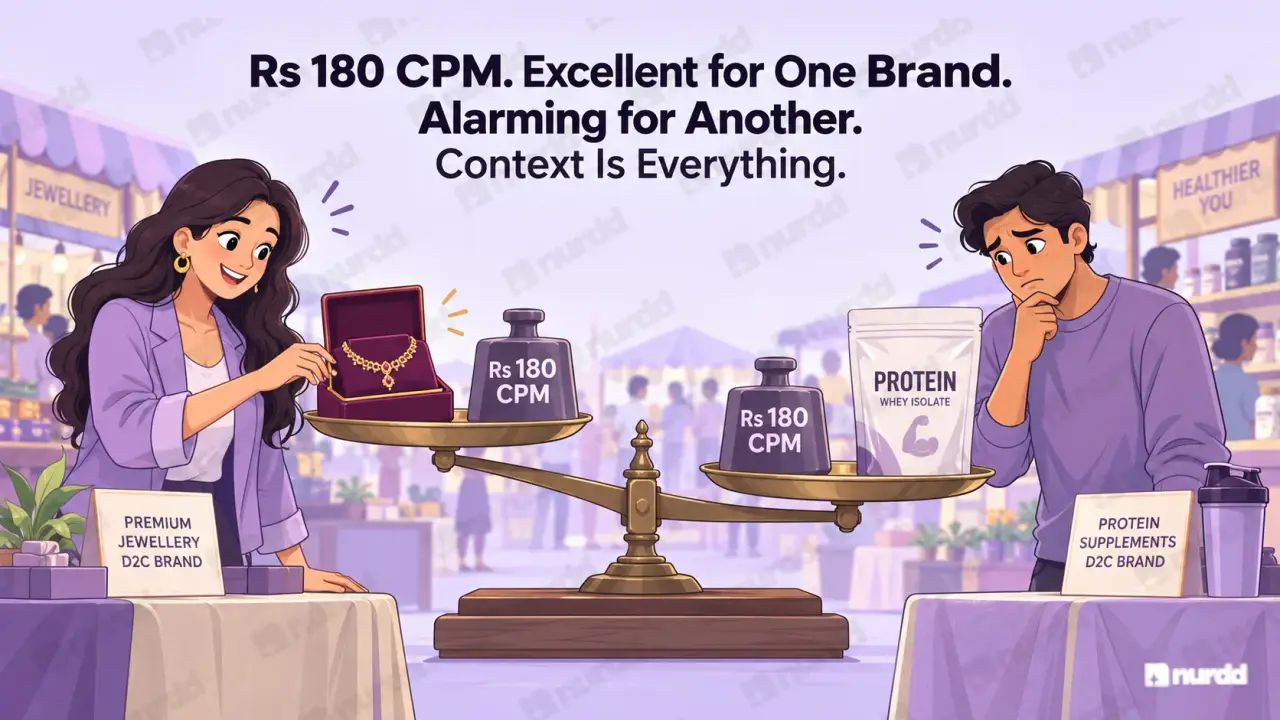
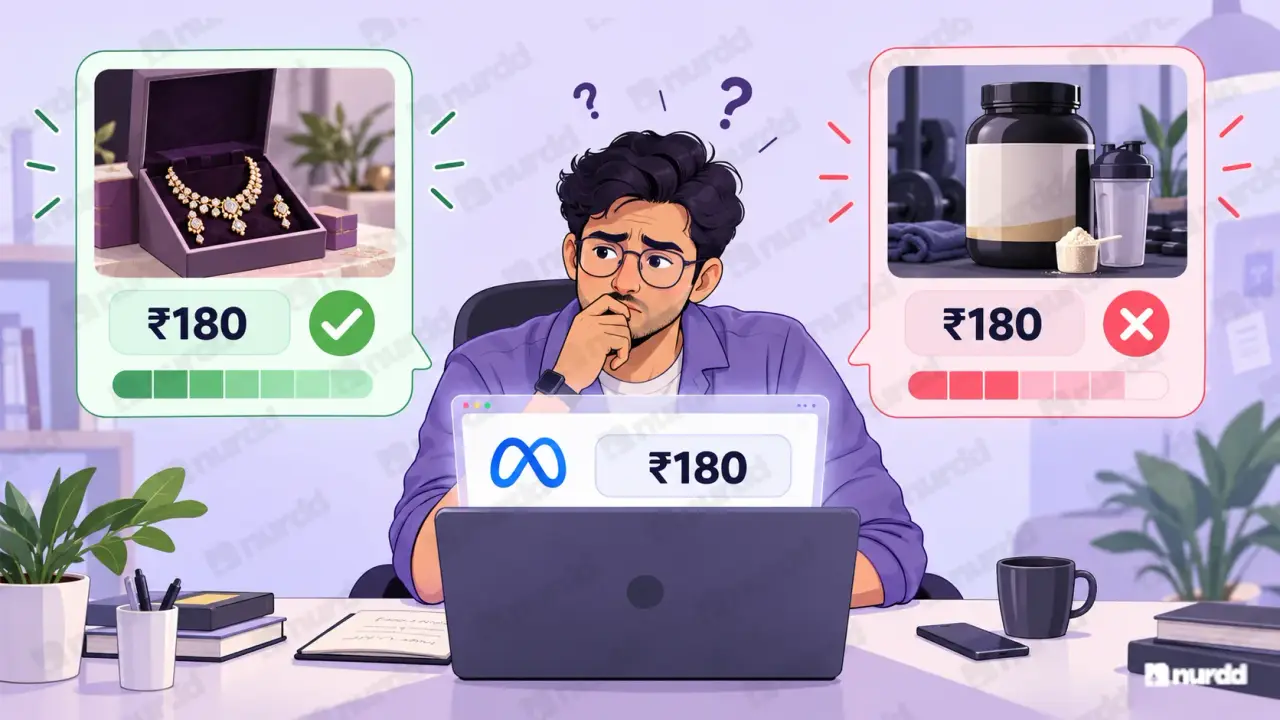
Compare against category-specific prospecting benchmarks, never blended account figures. A Rs 180 Meta CPM is excellent for premium jewellery and alarming for a high-volume supplement brand, and holding blended account ROAS up against prospecting benchmarks will always flatter your numbers.
Without benchmarks, your paid media numbers have no meaning. A CPM of Rs 180 on Meta might be excellent for a premium jewellery brand and alarming for a high-volume supplement brand. Here are the category-specific benchmarks that give your numbers context.
Before You Compare
Two Adjustments to Make First
These benchmarks reflect prospecting campaign performance new audience acquisition, not retargeting or branded search. If you compare your blended account ROAS to these benchmarks, your numbers will look better than they should.
These are also normalised benchmarks using 7-day click-only attribution for Meta and Data-Driven attribution for Google. If your account uses 7-day click plus 1-day view on Meta, your reported numbers will look 20 to 40% higher than these benchmarks. Strip out view-through before comparing.
Meta Ads Benchmarks
Meta Ads Performance by Category India 2026
Category | CPM (Rs) | CPC (Rs) | CTR | Prospecting ROAS |
|---|---|---|---|---|
Beauty and Skincare | 120 to 210 | 8 to 18 | 0.9 to 1.8% | 2.4 to 4.1x |
Health and Nutrition | 90 to 160 | 6 to 14 | 1.1 to 2.1% | 2.1 to 4.8x |
Fashion and Apparel | 70 to 140 | 5 to 12 | 1.4 to 2.6% | 1.8 to 3.2x |
Food and Beverage | 80 to 150 | 6 to 13 | 1.0 to 1.9% | 1.9 to 3.6x |
Home and Living | 90 to 170 | 7 to 16 | 0.8 to 1.6% | 2.0 to 3.8x |
Health and nutrition shows the widest ROAS range because performance is heavily influenced by claim strength. Brands with clinical backing hit the upper end. Brands with generic supplement positioning hit the lower end.
Beauty CPM is higher than other categories because the beauty advertiser pool in India is very competitive — particularly during festive and wedding seasons.
Google Ads Benchmarks
Google Ads Performance by Category India 2026
Category | CPC Non-Branded (Rs) | Conversion Rate | Target ROAS |
|---|---|---|---|
Beauty and Skincare | 15 to 45 | 2.1 to 4.3% | 3.0 to 5.0x |
Health and Nutrition | 20 to 60 | 1.8 to 3.5% | 2.5 to 4.5x |
Fashion and Apparel | 12 to 35 | 1.4 to 2.8% | 2.5 to 4.0x |
Food and Beverage | 10 to 28 | 1.6 to 3.2% | 2.2 to 3.8x |
Home and Living | 14 to 38 | 1.8 to 3.5% | 2.5 to 4.2x |
Google Shopping campaigns consistently outperform text ads in fashion and food categories because product visuals and price information reduce the need for the buyer to visit the site before deciding.
If your account in these categories relies only on text Search ads and not Shopping, your conversion rates and ROAS are likely below the benchmark range not because of targeting problems but because the campaign format is suboptimal.
Meta Prospecting ROAS by Category — India D2C 2026 (Normalised)

Why Benchmarks Look Different at Different Times of Year
CPMs on Meta spike 40 to 70% during the October to November festive season. Google CPC for category keywords similarly rises as seasonal spending pressure increases.
The relevant comparison is not your October numbers versus an annual average. It is October 2026 versus October 2025. Year-over-year at the same seasonal moment tells you whether your account is improving.
The monsoon opportunity: July to September consistently produces lower CPMs across most categories because advertiser competition drops. Brands that maintain consistent spending during monsoon typically build warm audience pools more efficiently than brands that pause seasonally.
Diagnosing Your Position
What to Do When Your Numbers Are Outside the Range
If your CPM or CPC is significantly above benchmark: Check these three things before adjusting bids.
Audience size: very narrow audiences drive up CPMs. Broaden targeting or switch to Advantage+ audiences.
Ad quality score or relevance diagnostics in Meta: low quality scores increase cost per result.
Seasonal auction pressure: CPMs during Diwali or Onam are expected to be elevated.
If your ROAS is significantly below benchmark: Check in this order, do not assume creative is the problem first.
Landing page conversion rate, low conversion rate is more commonly the cause of low ROAS than poor targeting.
AOV relative to category benchmark, if your AOV is below average, your ROAS ceiling is structurally lower.
Attribution window settings, 7-day click only will look lower than benchmarks that include view-through.
"Your numbers only mean something relative to your category. A number without a benchmark is not a performance measure. It is a guess wearing a label."

Sources and References
WordStream – Google Ads Benchmarks by Industry
Meta for Business – Ads Manager metrics glossary
Think with Google India – Consumer insights and market research
Nurdd / Pulse – Paid media benchmark resources for Indian D2C brands

Your ads are spending. Are they actually performing?
Pulse connects to Google Ads and Meta Ads to explain performance in plain language, diagnose what changed, and recommend specific actions — no data analyst needed.