Influencer Marketing Benchmarks India 2026: Engagement, Conversion, and Cost by Tier
 29 Aug 20268 min read
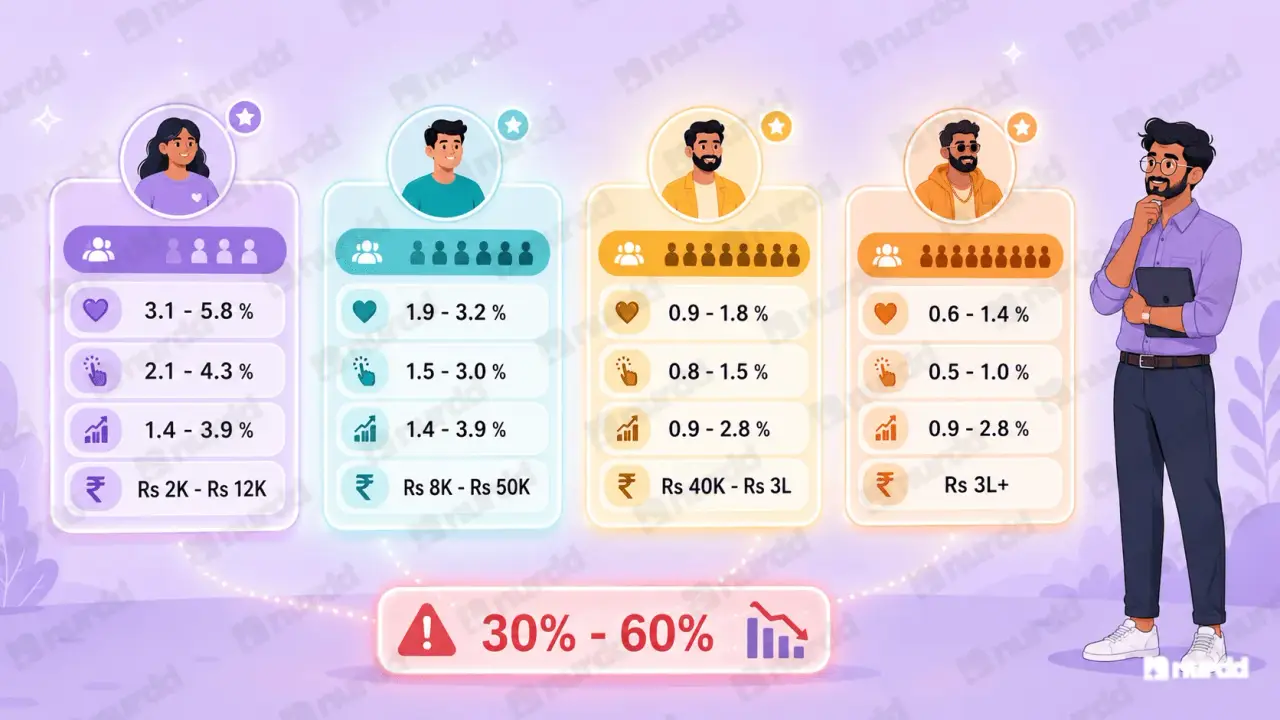
India benchmarks: nano 3.1–5.8% engagement, 1.4–3.9% conversion, Rs 2K–12K/post; micro 1.9–3.2%, 1.4–3.9%, Rs 8K–50K; macro 0.9–1.8%, 0.9–2.8%, Rs 40K–3L; mega 0.6–1.4%, 0.9–2.8%, Rs 3L+. Health and skincare tend toward higher conversion; promo-code-plus-UTM tracking reports 1.4–3.9% versus 0.9–2.8% for UTM-only.
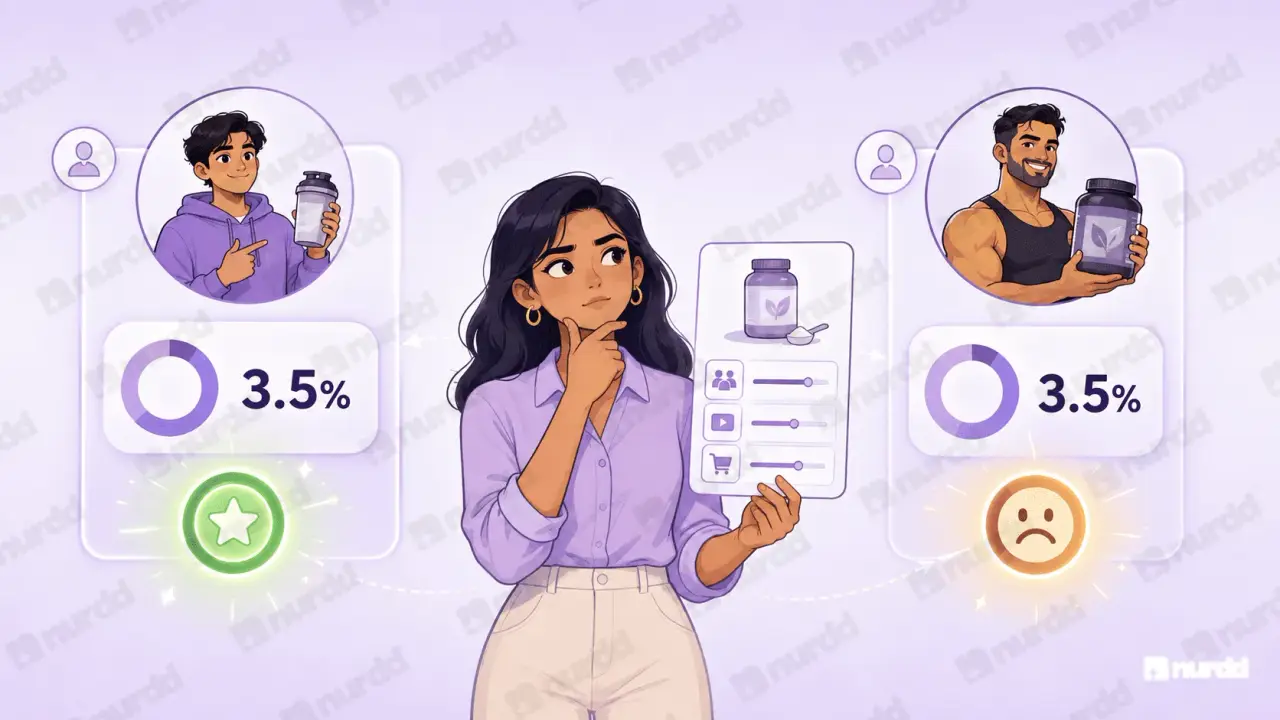
An engagement rate of 3.5% sounds good in the abstract and disappointing for a nano creator in a high-trust category. Context is everything. Here are the benchmarks that provide that context.
Before You Use These Numbers
Two Important Caveats
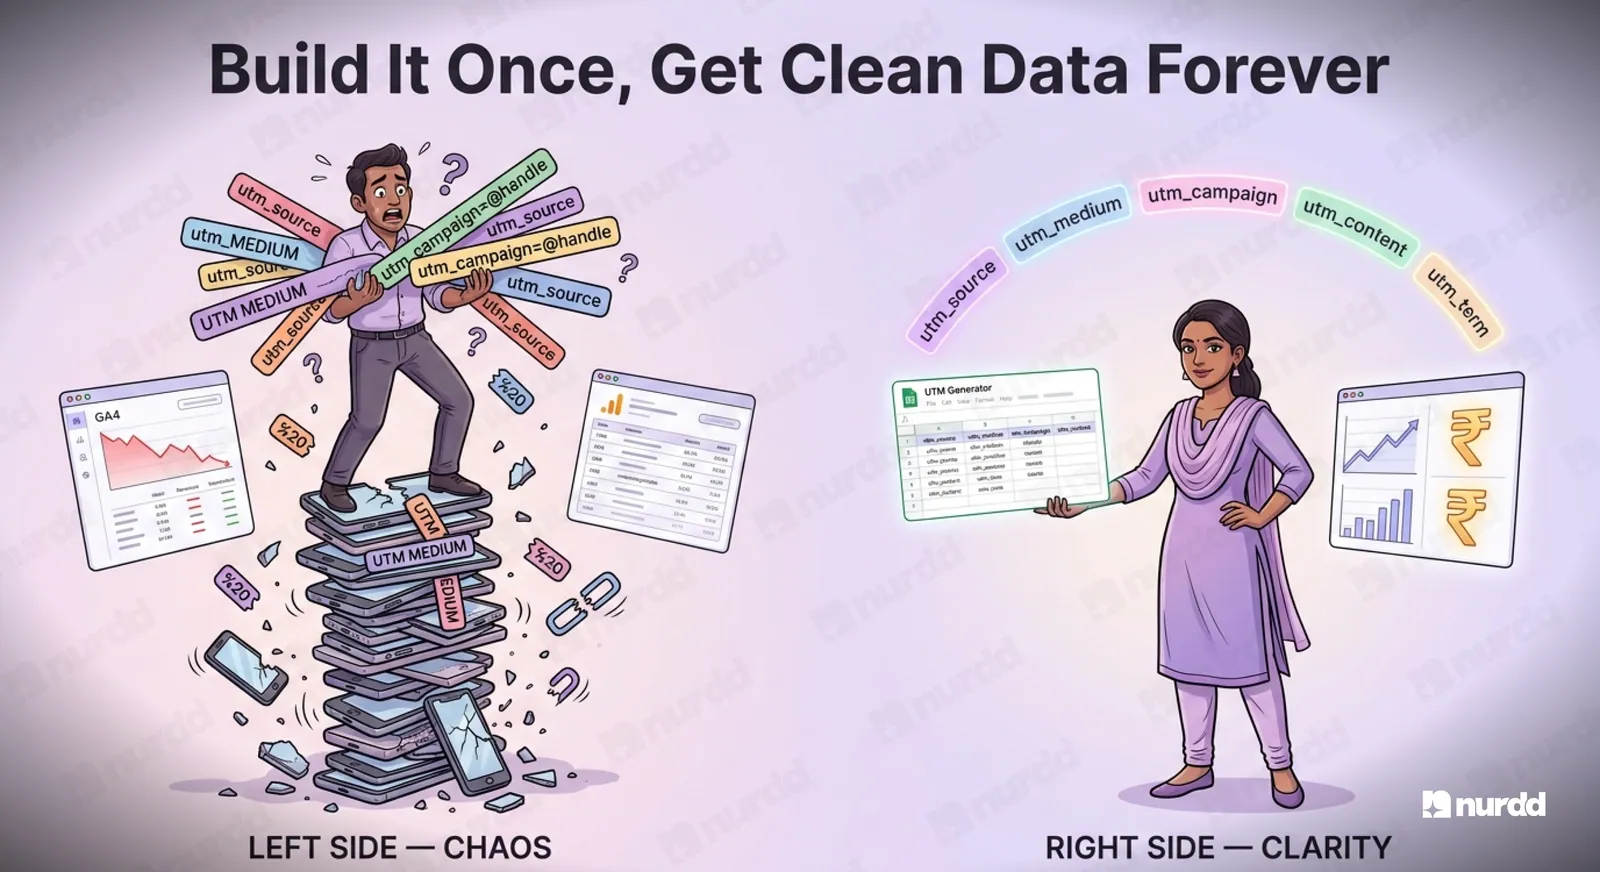
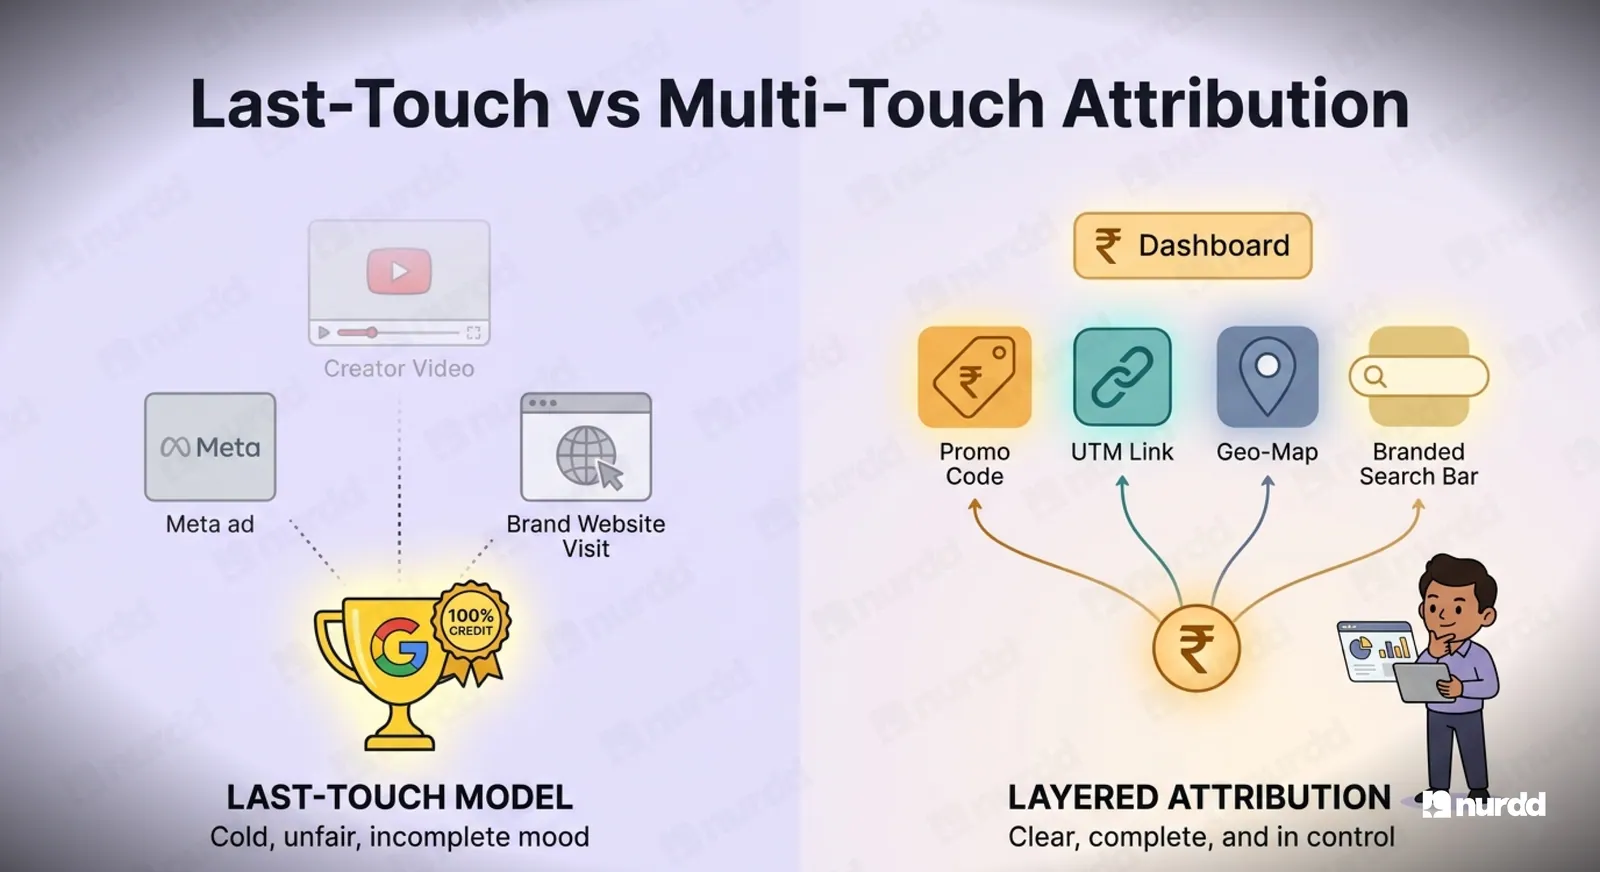
These benchmarks reflect campaigns where the brand tracked performance with dual-signal attribution UTM links plus promo codes. Brands using UTM-only tracking typically see lower apparent conversion rates because they are missing cross-device and cross-session conversions.
Categories also affect all benchmarks significantly. The numbers below cover health and nutrition, beauty and skincare, and food and beverage the three highest-volume D2C influencer marketing categories in India.
All Benchmarks in One Place
Creator Tier Benchmarks: Engagement, Conversion, and Cost
All four tiers in one view — engagement rate, story swipe-up rate, conversion rate, and cost per post.
Tier | Followers | Engagement (paid) | Story Swipe-Up | Conversion Rate | Cost per Post |
|---|---|---|---|---|---|
Nano | 5K – 30K | 3.1 – 5.8% | 2.1 – 4.3% | 1.4 – 3.9% | Rs 2K – 12K |
Micro | 30K – 200K | 1.9 – 3.2% | 1.5 – 3.0% | 1.4 – 3.9% | Rs 8K – 50K |
Macro | 200K – 1M | 0.9 – 1.8% | 0.8 – 1.5% | 0.9 – 2.8% | Rs 40K – 3L |
Mega | 1M+ | 0.6 – 1.4% | 0.5 – 1.0% | 0.9 – 2.8% | Rs 3L+ |
High-trust categories (health, skincare) see the upper end of swipe-up and conversion ranges. Lower-trust or lower-urgency categories (fashion, electronics) see the lower end.
At the macro and mega tier, audience composition matters more than engagement rate. A food creator with 800,000 followers will outperform a general lifestyle creator with the same following for a health supplement campaign.
Promo Code Effect- Traffic with a promo code converts at 1.4 to 3.9% vs 0.9 to 2.8% for UTM-link-only traffic. If you are not using promo codes alongside UTMs, you are likely underestimating your creator programme's revenue contribution by 30 to 60%.
Whitelisting rights on macro creator content typically add 30 to 50% to the base post rate but often worth it for high-performing content pieces you want to run as paid ads.
Category Differences
How Your Category Changes Which Metrics to Prioritise
Health and Nutrition: Conversion rate is the most critical metric. The purchase decision involves higher perceived risk. Creator authenticity a creator who has personally used the product for a sustained period converts at significantly higher rates than one doing their first promotional post.
Beauty: Content format drives benchmark variance more than any other variable. Reels demonstrating before-and-after transformations consistently outperform static posts on engagement and swipe-up rate.
Food and Beverage: Occasion context matters more than in other categories. A recipe creator producing content around specific meal occasions drives stronger conversion than a general lifestyle creator with the same following.
Choosing the Right Creator Tier
A Framework for Tier Selection by Campaign Goal
New product launch- need reach volume: Nano and micro tier, 15 to 30 creators, gifting-only or low-fee structure. The combined reach is substantial and the content diversity is valuable for understanding which messaging resonates.
Trust-sensitive product- need credibility signals: Micro creators with documented, long-term product affinity in your category. Reach is secondary. Authenticity is the mechanism of conversion.
Seasonal campaign- need immediate broad awareness: One or two macro creators with demonstrated category relevance plus a supporting micro creator programme running simultaneously. The macro creator creates broad awareness. The micro creators convert the consideration into purchase.
"A benchmark without category context is just a number. An engagement rate of 3% is excellent for a macro creator and disappointing for a nano creator in the same category."

Sources and References
Influencer Marketing Hub – Influencer Marketing Benchmark Report
Socialinsider – Instagram Engagement Rate Benchmarks
Meta for Business – Instagram Creator Tools and Insights
Nurdd / Nia – Creator attribution resources for Indian D2C brands

Find the right creators — and verify they're real.
Nia gives brands access to 10M+ Indian creator profiles, TruAI fake follower detection, pre-spend ROI forecasting, and product-level sales attribution. Completely free.