Attribution & Measurement
8 D2C KPIs That Beat ROAS for Profit in 2026
ROAS shows revenue, not profit. Here are 8 ecommerce KPIs D2C brands should track in 2026 to measure real, sustainable profitability.
 Simran Rawat6 Oct 20267 min read

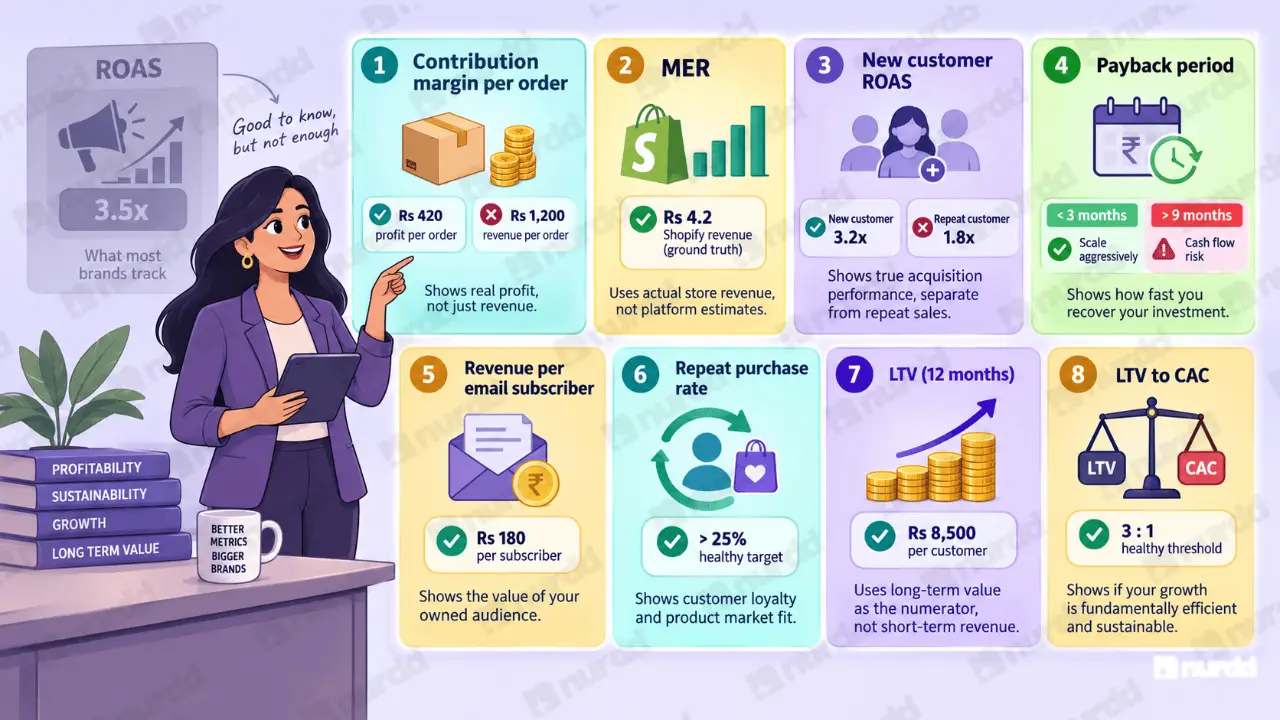
ROAS tells you how much revenue your ads drove per dollar spent. It tells you nothing about whether that revenue was profitable, whether those customers will return, or whether your business is actually growing in any meaningful sense. Here are the 8 metrics that predict D2C profit more accurately.

The Eight Metrics
Beyond ROAS: What to Track Instead
# | Metric | Formula | Why It Beats ROAS |
|---|---|---|---|
1 | Contribution Margin per Order | Revenue − COGS − variable fulfilment costs | Shows what each order actually contributes to profit. A ROAS of 3.5x on 28% margin generates less profit than 2.2x on 62% margin. |
2 | Marketing Efficiency Ratio (MER) | Total Revenue ÷ Total Marketing Spend (all channels) | Uses ground-truth Shopify revenue. Eliminates platform attribution inflation and double-counting. |
3 | New Customer ROAS | Revenue from new customers only ÷ Ad spend | Segments acquisition from repeat purchase. Tells you whether paid economics are sustainable at scale. |
4 | Payback Period | CAC ÷ Monthly Gross Margin per Customer | Brands with payback below 3 months can scale aggressively. Above 9 months = structural cash flow risk. |
5 | Revenue per Email Subscriber | Monthly email-attributed revenue ÷ Total list size | Tracks how effectively you are monetising the audience paid acquisition has built. |
6 | Repeat Purchase Rate | Customers who make a 2nd purchase within 90 days ÷ Total customers | Healthy D2C brands target above 25%. |
7 | LTV at 12 Months | Average total spend per customer in first 12 months | The numerator in your LTV:CAC ratio the most important long-term efficiency measure. |
8 | LTV:CAC Ratio | LTV ÷ CAC | Below 2:1 = unsustainable. 3:1+ = healthy. 5:1+ = significant growth potential being left on the table. |
MER Targets by Stage
What a Healthy MER Looks Like by Stage
Marketing Efficiency Ratio (MER) Targets for D2C Brands
Early stage (<$240K ARR)
Target MER: 2.5x – 4.0x
Growth stage ($240K–$1.2M)
Target MER: 3.5x – 6.0x
Scale stage (>$1.2M)
Target MER: 5.0x – 8.0x
Pulse explains your Meta and Google Ads performance in plain language, so you can read ad platform results alongside these profitability metrics instead of relying on ROAS alone.
Building Your Metric Stack
What to Track and How Often
Metric | Track Weekly | Track Monthly | Track Quarterly |
|---|---|---|---|
Blended ROAS / MER | ✅ | ✅ | ✅ |
Contribution Margin per Order | ✅ | ✅ | |
New Customer ROAS | ✅ | ✅ | |
Payback Period | ✅ | ||
Repeat Purchase Rate (90-day) | ✅ | ✅ | |
LTV at 12 months | ✅ | ||
LTV:CAC Ratio | ✅ | ||
Revenue per Email Subscriber | ✅ |
Not every metric needs weekly tracking. Tracking everything weekly creates data noise without decision clarity. The weekly metrics are the ones that indicate whether something is wrong right now and requires immediate action. Monthly and quarterly metrics inform budget allocation and strategic planning decisions that do not change week to week.
"ROAS tells you about yesterday's clicks. Contribution margin, MER, and payback period tell you about next year's business. Track the second set."

Sources and References
Triple Whale – Beyond ROAS: ecommerce profitability metrics resources
Shopify Blog – Key ecommerce metrics and KPIs to track
Inc42 – D2C unit economics coverage
Nurdd / Pulse – D2C profit KPI tracking resources for D2C brands