Attribution & Measurement
Influencer ROI Data Maturity Model for D2C Brands
A four-stage influencer ROI data maturity model for D2C brands: diagnose your stage, set up low-cost tracking and know what to build next.
 Simran Rawat30 Sept 202616 min read

The influencer ROI data maturity model has four stages: activity tracking, revenue attribution, cross-channel attribution and incrementality. Find your stage with a five-question diagnostic, then build only the next one. Stage 2 needs a unique tagged link and discount code per creator, and Stage 4 needs a holdout test.
An influencer ROI data maturity model is a four-stage ladder showing what a D2C brand can prove about creator campaigns: activity, revenue attribution, cross-channel attribution and incrementality. Find your current stage first, then build only the next one, because each stage supplies the clean data the next needs.
Key takeaways
- Name your stage with the five-question diagnostic below before you buy any measurement tool; a tool built for a higher stage cannot fix missing inputs.
- Stage 2 needs only a unique tracked link and a unique discount code per creator, plus a weekly sheet or report. Both can be set up at no extra cost if you already use Shopify and Google Analytics.
- No single method captures the whole picture. Links, codes and surveys each miss different buyers, so read them together.
- Stage 4 is a controlled test (holdout or geo-lift), not a better dashboard. Run it on a campaign type you will repeat.
- Rank creators by cost per sale first and by incremental cost per sale once you can test. Follower count is not a measurement stage.
- Move one stage at a time. Each stage produces the clean data the next stage consumes.
What is the influencer ROI data maturity model?
The influencer ROI data maturity model used here has four stages. Each stage is defined by the question a brand can answer with evidence, not by the software it owns. A brand that owns a sophisticated analytics suite but cannot name last campaign's cost per sale is still at Stage 1.
The ladder is deliberately narrower than broader operating models. The Paris agency TANKE publishes an influencer marketing maturity model with five levels and six dimensions, of which measurement and governance is one. This guide zooms into that single dimension and makes it actionable for a D2C team that owns its own store data.
| Stage | Question you can answer | Minimum evidence | Typical gap |
|---|---|---|---|
| 1. Activity tracking | Who posted, when, and how many views? | A list of creators, post dates and platform view counts | Nobody can name last campaign's cost per sale |
| 2. Revenue attribution | Which creators drove orders, and at what cost per sale? | Tagged link and unique code per creator, orders matched in a sheet or report | Code and link sales are counted separately, and neither sees view-through buyers |
| 3. Cross-channel attribution | How do creator touchpoints interact with Meta and Google ads? | Consistent UTM naming, an analytics attribution report, customer-journey paths | Credit is split by a model, which is an estimate, not proof |
| 4. Incrementality | How many sales would not have happened without the campaign? | A holdout or geo-lift test with a control group | Tests are one-off and not repeated per campaign type |
Many brands that start measuring creator campaigns begin at Stage 1 or 2. That is a normal starting point, not a failure, because Stage 2 is the stage that turns influencer spend into a number a finance lead will accept.
How do I know which stage my brand is at?
Answer the five questions below honestly and stop at the first one you answer no to. That question marks your current stage. Run it on your most recent completed campaign, not the one you plan.
- Can you list every creator you paid last campaign with the post date and cost? If no, you are below Stage 1 and need a basic campaign log first.
- Can you state cost per sale for each creator? If no, you are at Stage 1.
- Can you separate orders that came from a tracked link, a discount code, and neither? If no, you are at the start of Stage 2.
- Do you know what share of creator-attributed buyers also touched a Meta or Google ad? If no, you are at Stage 2.
- Have you ever held out a group, region or audience from a creator campaign and compared sales? If no, you are at Stage 3. If yes, you are at Stage 4.
A good sanity check on the first answer is your reporting language. When a campaign result is described as awareness, with no order count beside it, the brand is almost certainly at Stage 1. Awareness is a legitimate goal, but it needs its own measure such as a brand-search or survey lift test, which is a Stage 4 method.
Why does influencer ROI measurement stall?
Measurement stalls because creator influence leaves several different traces and no tool collects all of them. A viewer may click a link, remember a code, search your brand name later, or buy from a friend's recommendation. The Favikon attribution guide makes the same point: no single tracking method captures the whole picture, so treating one method as ground truth distorts the result.
The difficulty is widely reported. One roundup that cites the Influencer Marketing Hub benchmark report says measuring ROI and attribution complexity together account for 15.84% of reported challenges (Hypefy, checked October 2026). The figure tells you the problem is common, not that your brand is behind.
Link clicks, discount codes, post-purchase surveys and controlled tests each measure a different slice of creator impact. Stage 2 uses the first two; Stage 4 adds the one that can show causation.
Brands also stall because they buy for the stage they hope to reach. A multi-touch attribution product fed by inconsistent link tags produces confident-looking charts built on fragmented rows. Google's own guidance on URL builders in Analytics Help recommends a standardised UTM strategy so that data is not fragmented, and it says campaign names should match your internal platform names.
How do I move from Stage 1 to Stage 2 step by step?
Stage 2 is the most valuable jump because it converts creator activity into orders. Follow these steps in order; each one produces an output the next one needs.
Step 1: Create one naming convention before you create any links
Action: write down your values for utm_source, utm_medium and utm_campaign, for example the creator handle as source, influencer as medium, and the campaign name as campaign. Result: every link from every creator lands in analytics under predictable rows. Why: Google's documentation says inconsistent names fragment reporting, and a typo creates a separate row you will not find later. Our UTM structure guide for influencer campaigns gives a fuller template.
Step 2: Build one tagged link per creator and per placement
Action: generate links with Google's URL builder, using a separate link for a bio, a story and a video description if you can. Result: you can see which placement produced the visit. Why: the same creator can perform very differently by placement, and a single shared link hides it.
Step 3: Issue one discount code per creator and tie it to the link
Action: create a unique, capped code per creator in Shopify. Shopify has added the ability to attach an existing marketing campaign to a shareable discount link, which adds the campaign's UTM identifier and source to the URL (PowerCommerce, checked October 2026). Result: one link carries both the discount and the attribution payload. Why: the Influencer Marketing Hub comparison of coupon codes and tracking links shows a single URL can combine a code with UTM tags, which resolves a common attribution gap.
Step 4: Read each receipt in the right report
Action: read link sales in your analytics and Shopify campaign reports, and read code sales in the sales-by-discount-code report. The Causality Engine step-by-step Shopify guide describes this same two-receipt approach: a link with its own UTM tags and a capped code per creator. Result: two order counts per creator. Why: orders found by both are high-confidence, orders found by one are probable, and the difference tells you how leaky each method is.
Step 5: Add a post-purchase question
Action: add one free-text field to checkout or the confirmation page asking where the customer heard of you. Result: a third receipt that catches people who saw a creator and later typed your name into a browser. Why: this is the cheapest evidence of dark-social effects, which links and codes cannot see. Our guide to dark social and word-of-mouth attribution shows how to read it.
Step 6: Compute cost per sale and rank creators by it
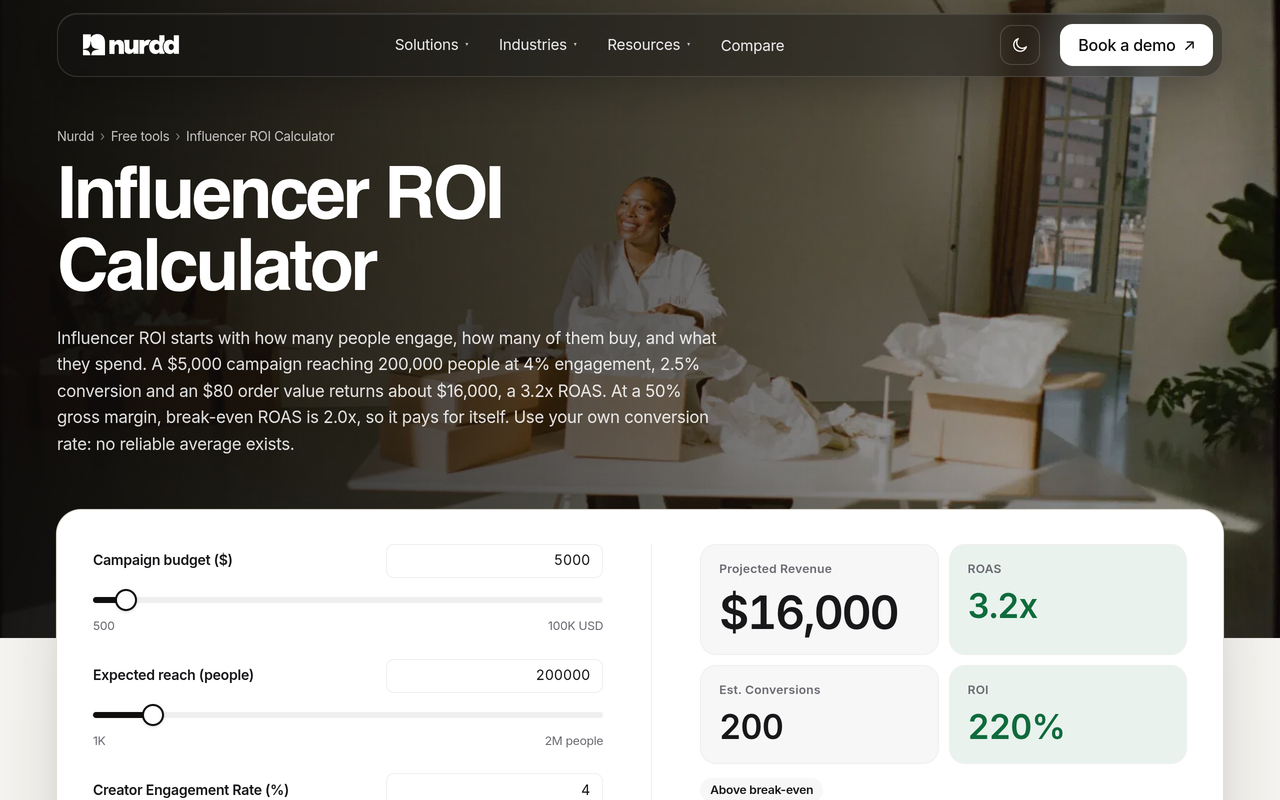
Action: for each creator divide total cost (fee plus product plus discount given) by matched orders. Result: a ranked list that replaces follower count as your selection criterion. Why: it is the first number a finance team will treat as a return. Use the influencer ROI calculator to project the outcome and the ROAS calculator to compare against paid channels.
What does a worked cost-per-sale example look like?
The numbers below are assumed round inputs chosen to show the arithmetic. They are not results from any brand, study or Nurdd customer. Replace them with your own.
| Line | Creator A (assumed) | Creator B (assumed) |
|---|---|---|
| Fee plus product plus discount given | $1,000 | $1,000 |
| Orders matched by link or code | 20 | 10 |
| Cost per sale (Stage 2) | $50 | $100 |
| Holdout result: share of orders that would have happened anyway | 60% | 10% |
| Incremental orders (Stage 4) | 8 | 9 |
| Incremental cost per sale | $125 | $111 |
At Stage 2 Creator A looks twice as efficient. Once a controlled test shows that most of A's orders came from existing demand, such as a creator promoting to your own loyal customers, Creator B is the better buy. This is the reason Stage 4 exists: it can reverse a ranking that Stage 2 gets confidently wrong.
How do I move from Stage 2 to Stage 3?
Stage 3 asks how creators and paid media work together. The goal is not a perfect model; it is a defensible view of overlap. Use this checklist in order.
- Lock your UTM names so creator traffic is never mixed into a generic social row.
- Open your analytics attribution reports and compare the default model against last-click for the same creator campaign. Google's Analytics Help page on the reporting attribution model describes attribution models as rules or data-driven algorithms that assign credit to touchpoints along a user's path, and lists data-driven as the recommended option.
- List overlap: for creator-attributed buyers, record whether a Meta or Google ad click or view appears earlier in the path.
- Tag your paid retargeting audience so you can see how many creator viewers it recaptures.
- Decide the credit rule in writing before you read the results, so you do not pick the model that flatters creators.
For the model choices and their trade-offs, read last-touch versus multi-touch attribution for influencer campaigns. If your Meta dashboard seems generous, why Meta ROAS can look inflated explains why overlap matters.
How do I reach Stage 4 with a holdout or geo-lift test?
Stage 4 uses a control group. As the Make Influence academy explains in its geo-lift and holdout testing guide, some areas see the campaign while others deliberately do not, and the difference estimates lift. On the paid side, Triple Whale's Meta conversion lift documentation describes how Meta's conversion lift experiments work, and a separate Triple Whale guide to incrementality testing methods notes that a conversion lift test is typically a user-level, platform-managed holdout.
A creator campaign is harder to randomise because you cannot choose who sees a creator's organic post. That is why geo and time-based holdouts are the practical option. For scale, Haus has analysed 640 Meta experiments on its platform, which shows that structured testing is a mature practice in paid media that creator teams can borrow (Haus, checked October 2026).
- Pick one repeatable campaign type, such as a product launch with ten micro creators.
- Choose test and control regions that have similar past sales and no overlapping major promotions.
- Fix the window and the success metric before launch: orders per region, not clicks.
- Run creators and paid retargeting only in test regions and keep everything else constant.
- Compare the sales difference and divide spend by incremental orders.
- Repeat once on a different region pair before you change budgets.
Our guide to calculating influencer campaign incrementality covers the maths in more detail.
Which method should I use for which question?
| Question | Best method | Stage | Cost to run |
|---|---|---|---|
| Did this creator's audience click through? | Tagged link, analytics session report | 2 | Free URL builder, minutes per creator |
| Did this creator's audience redeem? | Unique capped discount code report | 2 | Included in your Shopify plan |
| Did viewers buy without a trace? | Post-purchase question | 2 | One form field |
| Did creators and ads overlap? | Analytics attribution comparison | 3 | Analyst time |
| Did the campaign cause extra sales? | Geo or time holdout | 4 | Some withheld reach |
| Is this creator's audience real? | Audience audit before payment | Pre-stage | Estimator or platform |
The last row sits outside the ladder on purpose. Measurement cannot rescue a campaign paid to an audience that was never real, so run a fake follower audit first. The fake follower checker gives a quick estimate from engagement.
What are the most common measurement mistakes?
- Buying for the wrong stage. Incrementality tooling with no Stage 2 data has nothing to measure.
- Treating code redemptions as total sales. Codes leak to coupon sites and miss buyers who never use them.
- Sharing one code or link among creators. You lose the ability to rank anyone.
- Changing UTM names mid-campaign. It splits the data into rows nobody reconciles.
- Reading a viral post as a result. See why a best-performing creator post can produce zero sales.
- Ignoring the cost of the discount. A code is a cost line in cost per sale.
- Stopping at ROAS. Revenue over spend ignores margin; see the D2C KPIs that predict profit better than ROAS.
How does Nia by Nurdd help at each stage?
Nia by Nurdd is an AI-native creative studio at getnia.studio, also on iOS and Android, with influencer marketing built in. For measurement it covers the parts of the ladder that are slow to do by hand: it finds creators from a database of 10M+ profiles, detects fake followers with TruAI, generates a pre-spend ROI forecast, and attributes product-level sales to specific creators after a campaign closes. Nia is priced below comparable platforms.
At Stage 2, Nia covers creator discovery, vetting, forecasting and attribution in one product rather than across separate sheets. For Stage 3 and 4 you still need your analytics and a controlled test, and the per-creator data that Nia produces is the clean input those need. Read how Nia works on the Nurdd overview of Nia or the creator-side page.
Book a demo at https://www.nurdd.club/demo to see, for your own brand, how Nia forecasts ROI for a shortlist of creators before you brief anyone and how product-level sales are tied back to each creator after the campaign.
How does Nia fit alongside a spreadsheet-and-links stack?
| Stage | Manual stack you can start today | Where Nia by Nurdd adds |
|---|---|---|
| 1 | Campaign log, view counts | Creator discovery and vetting before spend |
| 2 | Tagged links, unique codes, sheet | Pre-spend ROI forecast and product-level attribution per creator |
| 3 | Analytics attribution reports | Clean per-creator rows that feed overlap analysis |
| 4 | Geo or time holdout you design | Per-creator results to compare against the test |
Start with the marketing budget planner to split spend across creators, Meta and Google, and benchmark a finished campaign with the campaign benchmarker. To choose which creators to test first, see how to pick influencers based on predicted sales. For category examples, browse the beauty industry page, and the broader D2C measurement framework for how creators, ads and AI search fit together.
What should each team report to finance at each stage?
A maturity model is only useful if it changes what you tell the people who approve budget. The wording below keeps claims inside what the evidence supports, which protects your credibility when a number is challenged.
| Stage | Claim you can safely make | Claim to avoid |
|---|---|---|
| 1 | The campaign reached a stated number of views across named creators. | The campaign returned a stated multiple of spend. |
| 2 | Tracked links and codes produced a stated number of orders, so cost per sale was at most a stated amount per creator. | Those are all the orders the creators caused. |
| 3 | A stated share of creator-attributed buyers also touched paid ads, so credit is shared under a stated rule. | The model proves which touchpoint caused the sale. |
| 4 | The test group outsold the control group by a measured difference, over a defined window. | The result applies to every future campaign type. |
Note the phrase at most in the Stage 2 row. Because links and codes miss some buyers, cost per sale from tracked orders is an upper bound on true cost per attributed sale, which is a more honest way to present it than a single precise figure.
How does this look for a founder, a growth marketer and a finance lead?
A founder running creators personally
The founder usually starts at Stage 1 because creators are found through direct messages and results live in a chat thread. The most useful move is Steps 1 to 3 above: one naming convention, one link and one code per creator. The aim is to be able to answer one question on Monday morning: which creator produced orders last week?
A growth marketer balancing creators and paid media
A growth marketer typically has Stage 2 data and a paid account that is already optimising towards conversions. Their risk is double counting, where the same buyer is credited to a creator and to a retargeting ad. The priorities are the Stage 3 overlap list and a written credit rule, followed by a single holdout on the largest creator budget. The Meta learning phase guide is useful here, because changing audiences mid-test can distort a result.
A finance lead reviewing influencer spend
A finance lead wants to know whether spend is repeatable. They should ask for the stage, the matched-order method, the discount cost included in cost per sale, and whether any control group exists. A campaign that cannot answer the last question is at Stage 3 or below, and its results should be treated as estimates until a holdout confirms them.
If your team spans more than one role, agree on one stage label per programme and report it in every review. That avoids two people quoting two different return figures for the same campaign.
How does this model differ from other maturity models?
Operating models such as TANKE's score a whole programme across several dimensions, including team, sourcing and creative. This measurement ladder scores only what you can prove about return. Use a broad model to decide where the programme is weak and this ladder to decide what to instrument next. Attribution models like last-click and multi-touch are techniques within Stage 3, and incrementality is the only technique here that tests causation directly.
What should I do next?
Run the five-question diagnostic on your last campaign, write down your stage, and set up the single missing piece: a naming convention for Stage 1, per-creator links and codes for Stage 2, an overlap report for Stage 3, or one holdout for Stage 4. Then re-run the diagnostic after your next campaign.
If you want a second pair of eyes, book a demo and bring your last creator campaign. You will see how Nia by Nurdd would shortlist, vet and forecast creators for your brand, and how sales would be attributed back to each one.
How we researched this
We reviewed published guidance from Google Analytics Help, an agency's maturity model, measurement vendors' and agencies' guides on attribution, discount codes and holdout testing, and Shopify-related update coverage. We checked the pages on the publication date of this post and kept only claims we could tie to a source. The worked example uses assumed inputs and is labelled as such. We did not run hands-on tests of the tools mentioned and do not cite customer data.
Frequently asked questions
What is an influencer ROI data maturity model?
It is a staged framework that describes how well a brand can measure the return on creator campaigns. This version has four stages: activity, revenue attribution, cross-channel attribution and incrementality. Each stage is defined by the questions you can answer with evidence.
What is the easiest way to improve influencer ROI measurement?
Give every creator a unique tagged link and a unique discount code, then record matched orders per creator each week. This is Stage 2 and uses tools most stores already have. It lets you rank creators by cost per sale instead of follower count.
Are discount codes or UTM links better for tracking influencers?
Neither is complete, so use both. Links catch people who click, and codes catch people who remember and redeem. Attribution guides such as Favikon's note that no single method captures the whole picture.
How do I know if influencer marketing is incremental?
Run a controlled test. Hold out a comparable region or audience from the campaign, compare sales with the exposed group, and divide spend by the extra orders. Geo-lift and holdout tests are the practical methods for creator campaigns.
Do I need multi-touch attribution for influencer campaigns?
Only after Stage 2 is reliable. Multi-touch models split credit using your tagged data, so inconsistent naming produces unreliable output. A model is an estimate; a holdout is the way to test causation.
Should I check for fake followers before measuring ROI?
Yes. Measurement will only tell you that a campaign failed, not that the audience was never real. Audit audiences before payment, using a checker or a platform that offers detection, such as TruAI in Nia by Nurdd.
How long does it take to set up Stage 2 measurement?
The links, codes and a tracking sheet can be built in a day for a small creator roster, with a short weekly update after that. Larger rosters take longer mostly because of coordination with creators.
How is Nia by Nurdd priced?
Nia is priced below comparable platforms. Book a demo at nurdd.club/demo to see it working on your own brand.