Attribution & Measurement
How to Forecast Influencer Campaign ROI Before You Spend a Single Rupee
Build a realistic influencer campaign ROI forecast before committing your budget, using creator reach, conversion rate and gross profit instead of revenue.
 Simran Rawat2 Sept 2026 7 min read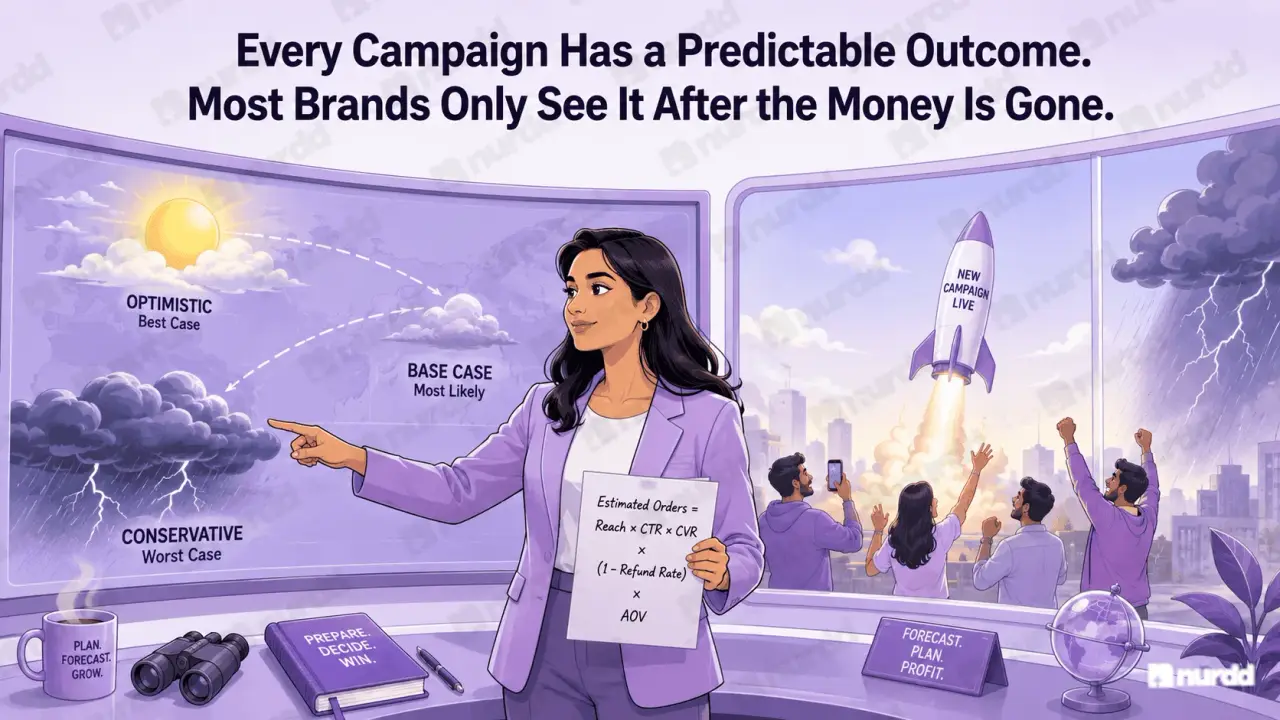
Forecast influencer ROI by estimating orders as reach × CTR × creator-specific conversion rate, then calculate (revenue × gross margin − campaign cost) ÷ campaign cost × 100. Use actual recent reach, featured-product AOV, and three scenarios; plan around the conservative case.
How to Forecast Influencer Campaign ROI Before You Spend a Single Rupee
Every influencer campaign has a financial outcome that was largely predictable before it started — if you knew what inputs to use. Most brands find out whether a campaign worked after the money is gone. Here is how to build a pre-campaign ROI forecast.
Three Input Mistakes That Make Forecasts Useless

Before You Build the Model
Mistake 1: Using follower count as the reach estimate. Instagram feed reach for paid posts typically ranges from 8 to 20% of follower count. Instead, ask the creator directly for their average Story views and feed reach from their last five paid posts. Use the lower end of the range they give you.
Mistake 2: Using your website's overall conversion rate. Creator traffic is colder than direct or email traffic. Use 60 to 70% of your overall website conversion rate as your creator-specific estimate. A brand with 2.5% overall conversion should use 1.5 to 1.75% for creator traffic forecasting.
Mistake 3: Using revenue instead of gross profit as the ROI denominator. A campaign generating Rs 50,000 in revenue at 60% gross margin produces Rs 30,000 in gross profit. If the campaign cost Rs 25,000, the margin-adjusted ROI is 20% — not 100%. For high-product-cost brands, margin-adjusted ROI can be dramatically lower than revenue-based ROI suggests.
The Four Inputs

What You Need Before Building the Model
① Creator Reach
Ask for actual Story views from last 5 paid posts. Use conservative end.
② Click-Through Rate
Nano/micro: 1.5–2.5%. Macro: 0.8–1.5%. Use your own data if available.
③ Conversion Rate
Your site's overall rate × 60–70%. Creator traffic is colder than direct.
④ AOV
Pull from Shopify for the featured product not your overall store average.
The Forecast Formula
Estimated orders = Reach × CTR × Conversion Rate
Estimated revenue = Orders × AOV
Margin-adjusted ROI = (Revenue × Gross Margin % − Campaign Cost) ÷ Campaign Cost × 100
A worked example:
Creator reach: 80,000
CTR 1.8% = 1,440 clicks
Conversion rate 1.6% = 23 orders
AOV Rs 1,400 = Rs 32,200 estimated revenue
Campaign cost: Rs 18,000
At 55% gross margin: Gross profit Rs 17,710. Campaign cost Rs 18,000. ROI is slightly negative.
Worth knowing before you spend, not after. If the model produces negative ROI at base case inputs, either negotiate the cost down, reconsider the creator-product alignment, or do not run the campaign at the proposed terms.
Always Run Three Scenarios
Stress-Testing the Forecast
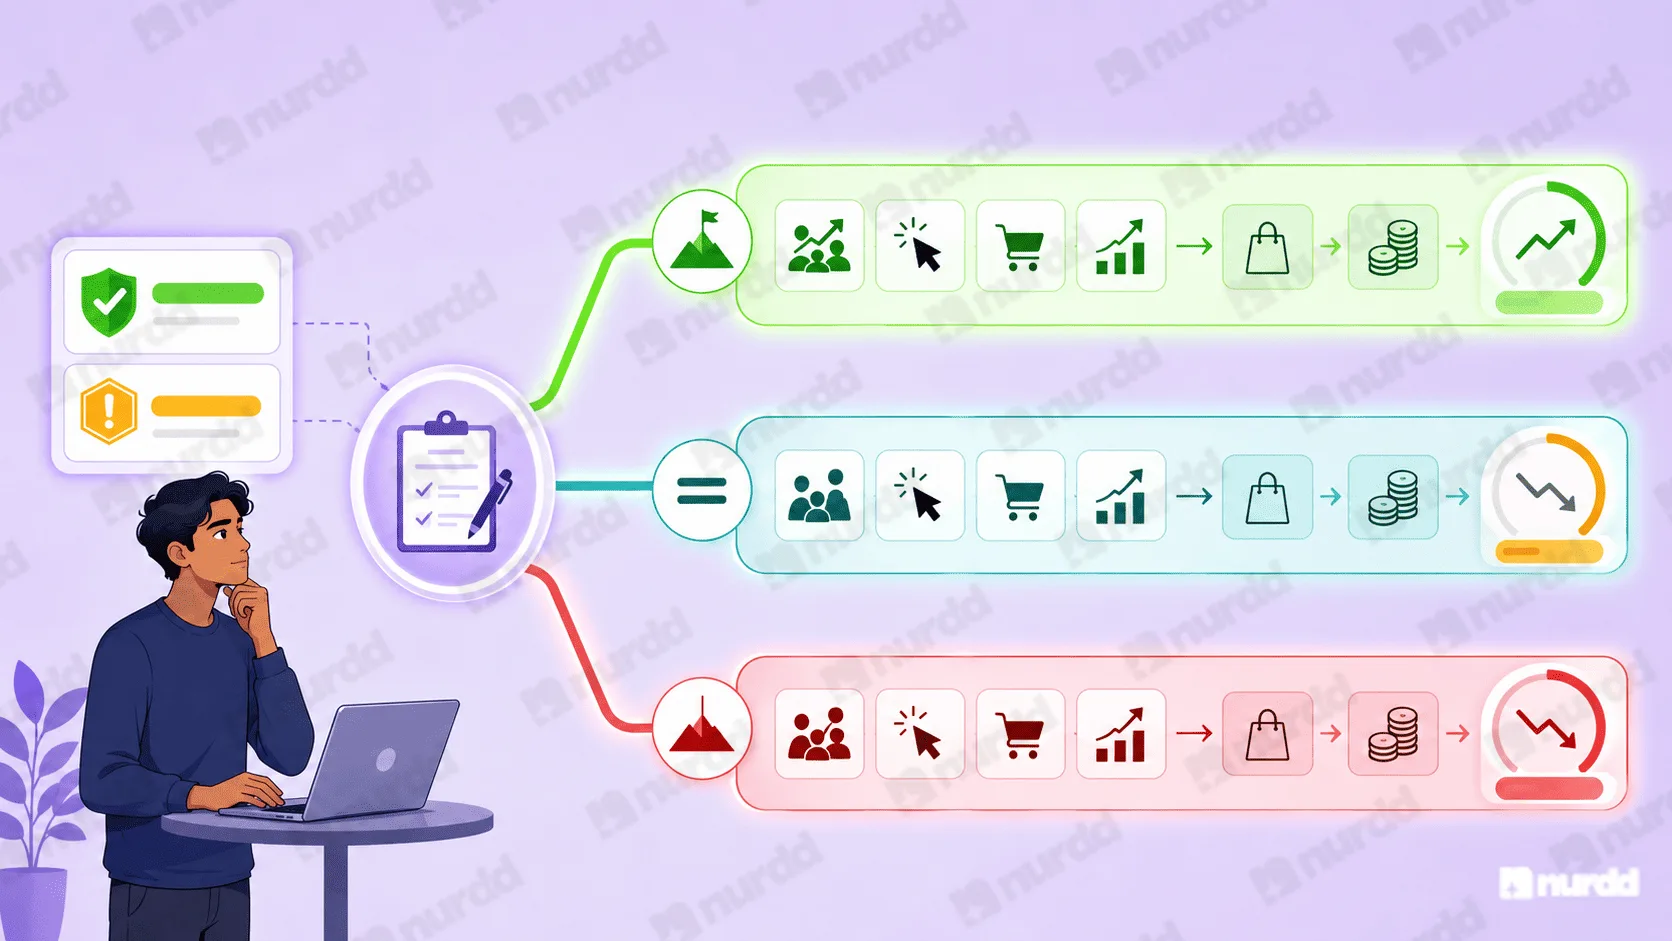
Never rely on a single-scenario forecast. Run the model at three input sets:
Optimistic: Upper end of CTR and conversion estimates, creator's highest recent reach
Base: Midpoints of all ranges
Conservative: Lower end of CTR, 60% of website conversion rate, creator's lowest recent reach
Plan around the conservative scenario. Base and optimistic represent upside, not baseline expectation.
Scenario | Creator Reach | CTR | Conv. Rate | Est. Orders | Est. Revenue | Margin ROI |
|---|---|---|---|---|---|---|
Optimistic | 90,000 | 2.2% | 1.8% | 36 | Rs 50,400 | +72% |
Base | 80,000 | 1.8% | 1.6% | 23 | Rs 32,200 | −2% |
Conservative | 65,000 | 1.4% | 1.3% | 12 | Rs 16,800 | −49% |
Assumptions: AOV Rs 1,400 · Campaign cost Rs 18,000 · Gross margin 55%
If your conservative scenario still produces positive margin-adjusted ROI, the campaign has a strong risk-adjusted case. If your optimistic scenario barely produces positive ROI, renegotiate or reconsider.
Building Better Forecasts Over Time
How Historical Data Makes Your Forecasts More Accurate
The first forecast for a new creator tier will have wide uncertainty bounds you are using category benchmarks rather than your own performance data.
Every campaign you run with disciplined tracking generates proprietary data that narrows those bounds for future forecasts.
Build a historical input database one row per past campaign, with columns for creator tier, category, content format, creator reach, CTR achieved, conversion rate achieved, AOV, and margin-adjusted ROI. After ten or more campaigns with disciplined tracking, your historical average CTR by creator tier becomes more accurate than any industry benchmark.
"A campaign with a good forecast and bad results teaches you something. A campaign with no forecast and bad results teaches you nothing except that you spent money."
Sources and References
Traackr – Influencer Marketing Resources and Reports
Influencer Marketing Hub – How to Calculate Influencer Marketing ROI
Shopify Help – Acquisition reports: understanding conversions
Nurdd / Nia – Pre-campaign forecasting resources for Indian D2C brands