Influencer Marketing
Macro vs Micro Influencer Strategy for B2B SaaS
Choose between macro and micro influencers for B2B SaaS by scoring ICP density, matching tier to funnel stage, and testing the split yourself.
 Yashasvi Sharma13 Feb 202614 min read

For B2B SaaS, a macro vs micro influencer strategy should start from how many of a creator's followers match your ideal customer profile, not from follower count. Micro creators usually earn the evaluation-stage trust, while macro voices help most when buyers do not yet know your category. Fixed splits such as 70/30 have no verifiable source, so test your own split over eight weeks.
A macro vs micro influencer strategy for B2B SaaS works best when you choose creators by how many of their followers match your ideal customer profile (ICP), then use micro creators for evaluation-stage trust and macro voices for category awareness. Follower count alone is a poor guide. This guide gives you a scoring method, a decision table and an eight-week test to set your own split.
Key takeaways
- Score every creator on ICP density (followers who match your buyer profile) before you compare tiers or prices.
- Use micro creators (10,000 to 100,000 followers) for evaluation-stage proof and macro creators (100,000 to 1 million) for category awareness, as ContentGrip, May 2026 defines them.
- Do not adopt a fixed split such as 70/30 on trust. No primary source we could find backs it, so treat any split as a hypothesis you test.
- Pay a base fee plus a performance bonus tied to a qualified event (trial, demo, sales-accepted lead), and tag every link before the first post.
- Run macro and micro in sequence for eight weeks and compare against a holdout, so you can see the assist, not just the last click.
Why is macro vs micro framed differently in B2B SaaS?
Consumer influencer marketing rewards volume, because almost anyone who sees the product can buy it. B2B SaaS does not work that way: a purchase usually involves a buying committee, a long evaluation and a shortlist. ContentGrip (May 2026) describes a six-figure SaaS deal as involving three to seven stakeholders and an evaluation measured in weeks or months.
That changes what a creator is worth. A creator with 400,000 followers is only valuable to a SaaS brand to the extent that followers hold the job titles, company sizes and problems your product serves. For that reason, the useful question is not "micro or macro?" but "which creators put my product in front of the right people at the right moment?"
Quotable definition: for B2B SaaS, a micro-influencer is a practitioner with roughly 10,000 to 100,000 followers whose audience is concentrated in one professional domain, while a macro-influencer has roughly 100,000 to 1 million followers and shapes category-level opinion (ContentGrip, May 2026).
Awin (July 2026) adds a useful reminder: it cites research from The Influencer Marketing Factory in which marketers ranked subject matter expertise (53%) and trustworthiness (52%) among the top qualities they want in B2B creators. Awin also notes that many of LinkedIn's most influential creators have fewer than 5,000 followers, so the tier labels are a rough guide, not a quality score.
What does the evidence say about micro and macro creators for B2B?
The public evidence is thinner than most listicles suggest, so it is worth being precise about what is known. The table below separates figures we could trace to a named source from claims that circulate without one.
| Claim | Status | Source |
|---|---|---|
| LinkedIn micro creators (about 10,000 to 50,000 connections) have a median engagement rate of about 3.83%, against 2.94% for the platform overall | Reported by ContentGrip from a SociaVault 2026 study of 40,000+ profiles | ContentGrip, May 2026 |
| Micro creators in B2B often charge US$300 to US$1,500 per piece of content | Stated by ContentGrip as a working range | ContentGrip, May 2026 |
| 67% of B2B brands cite increasing brand awareness as their primary influencer objective | Cited by ContentGrip from Sprout Social's Q1 2025 Pulse Survey | ContentGrip, May 2026 |
| 75% of B2B businesses already use B2B influencers on LinkedIn, and 93% of CMOs plan to increase investment | Cited by Awin from a 2025 Ogilvy survey | Awin, July 2026 |
| 81% of UK B2B marketers say creators increase trust and credibility among decision-makers | LinkedIn research (1,299 global B2B marketers surveyed), reported for the UK sample | Marketing Week, 2026 |
| 58% of UK B2B buyers who use creators rely on them to confirm recommendations at the final stage of buying | Same LinkedIn research, UK sample | Marketing Week, 2026 |
| "Micro creators return roughly 20:1 and macro roughly 6:1"; "a 70/30 split adds about 23% ROI" | Not verified. We could not trace these to a primary study, so we do not use them | None found |
Two readings follow. First, the strongest evidence supports the direction (trust and expertise beat raw audience size), not a precise multiplier. Second, the Marketing Week figures describe UK respondents, so read them as a signal, not a global average.
Nowix (October 2026 update) reaches a similar verdict from general influencer data: micro creators win on conversions and niche trust, macro creators win on reach and speed, and brands needing both should run them in sequence. That sequencing idea is the backbone of the method below.
Is the 70/30 macro-micro rule real?
No source we found establishes a 70/30 split as a rule for B2B SaaS. The ratio appears in marketing blogs, but we could not trace it, or the ROI multiples attached to it, to a study with a stated method. Presenting it as settled would be guesswork.
What the evidence does support is a principle: allocate by funnel stage and audience fit. A brand with strong category awareness and a long shortlist has little reason to buy reach. A brand nobody in the category has heard of may need macro-level exposure before micro content gets a hearing. The split is therefore an output of your situation, which the steps below help you calculate.
Nurdd builds Nia, and its forecasting logic follows the same principle: estimate expected return before spending, then check it afterwards. Our guide on picking influencers on predicted sales, not follower count covers that logic in depth.
How do you choose between macro and micro influencers for B2B SaaS?
Work through the seven steps below in order. Each step produces a number or a decision you can use in the next one.
Step 1: Define your ICP in filterable terms
Action: write the ICP as attributes you can check on a creator's audience, such as job function, seniority, company size and industry. Result: a short scorecard of three to five attributes. Why: without filterable attributes, "relevant audience" becomes a feeling, and the loudest creator wins.
Keep the list short. A RevOps tool might use job function (revenue operations, sales operations), company size band and region. A developer tool might use role, stack and open-source involvement.
Step 2: Score each creator on ICP density
Action: estimate the share of a creator's followers who match the scorecard, then multiply by follower count. Result: an estimated ICP audience. Why: this is the number that actually connects to pipeline.
ContentGrip offers a clean illustration. A SaaS operator with 4,000 LinkedIn connections, 60% of them fintech CTOs, is worth more to a fintech vendor than a tech commentator with 400,000 followers of whom 0.5% fit the ICP.
| Creator | Followers | ICP share | ICP audience |
|---|---|---|---|
| SaaS operator (micro) | 4,000 | 60% | 2,400 |
| Tech commentator (macro) | 400,000 | 0.5% | 2,000 |
The inputs come from ContentGrip, May 2026; the multiplication is ours. The operator reaches more ICP buyers (2,400 against 2,000) from a following one hundredth the size.
Step 3: Convert ICP audience into cost per ICP contact
Action: divide the quoted fee by the ICP audience. Result: a cost per ICP contact you can compare across tiers. Why: it puts a fixed-fee macro post and a micro post on the same footing.
Worked example using the same two creators. ContentGrip gives US$300 to US$1,500 as a working range for micro creators in B2B. At the top of that range, the operator costs $1,500 ÷ 2,400 = $0.625 per ICP follower. For the macro commentator to match that, the fee would need to be $0.625 × 2,000 = $1,250 or less. If the commentator quotes more, the micro creator wins on this measure.
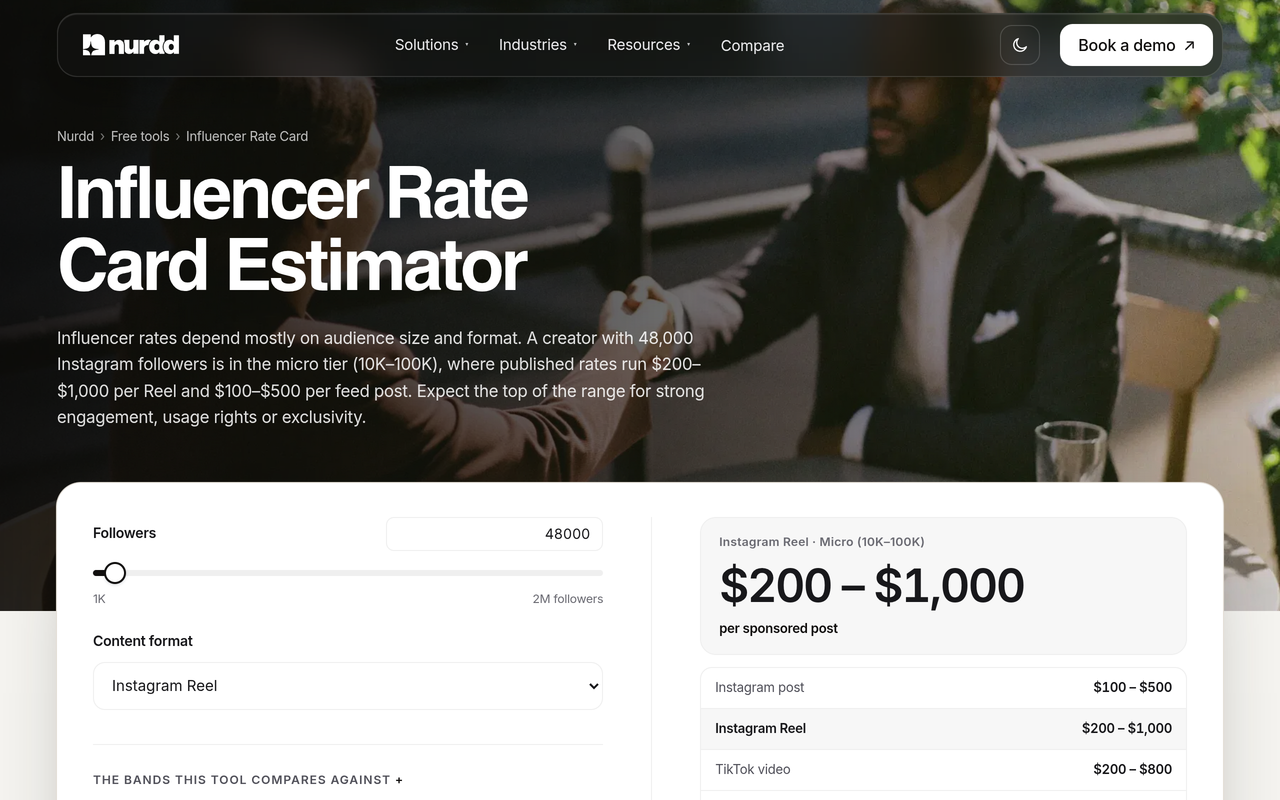
Treat this as an upper bound on reach, because not every follower sees every post. The point of the exercise is the comparison, and you can recalculate it with your own quotes in the influencer rate card estimator, which lists published USD rates by tier and format.
Step 4: Match tier to funnel stage
Action: decide which job each creator does. Result: every creator has one primary role and one metric. Why: macro and micro creators fail when asked to do each other's jobs.
| Funnel stage | Buyer question | Better-fit tier | Primary metric |
|---|---|---|---|
| Category awareness | "Is this a real problem, and who solves it?" | Macro (analysts, commentators, keynote voices) | Brand search lift, ICP reach |
| Shortlist building | "Which vendors should we look at?" | Macro and upper micro | Direct and branded traffic, shortlist mentions |
| Evaluation | "Does it fit our workflow?" | Micro practitioners | Demo requests, trial starts, saves and comments |
| Final confirmation | "Do people like us trust this?" | Micro and peer voices | Sales-accepted leads, win rate in assisted deals |
| Expansion and renewal | "How do others get more from it?" | Customer-practitioners | Feature adoption, renewals |
The final-confirmation row has support: Marketing Week reports that 58% of UK B2B buyers who use creators rely on them to confirm recommendations at the final stage of buying. The awareness row reflects Sprout Social's finding, reported by ContentGrip, that 67% of B2B brands name brand awareness as their main influencer goal.
Step 5: Set a starting split from your situation
Action: pick a starting allocation from the table, then plan to change it. Result: a split with a stated reason. Why: a split with a reason can be tested, while a borrowed ratio cannot.
The percentages below are our suggested starting hypotheses, not benchmarks. They have not been tested, and you should replace them with your own results after the first cycle.
| Your situation | Suggested starting emphasis | Reasoning |
|---|---|---|
| Unknown brand in a new category | More macro and category voices | Buyers cannot shortlist what they have never heard of |
| Known brand, weak trial conversion | Mostly micro practitioners | The gap is evaluation-stage proof |
| Low price, self-serve product | Mostly micro, with affiliate-style pay | Short cycle, one decision-maker |
| High price, enterprise buying committee | Balanced, with a macro or analyst anchor | Many stakeholders need repeated credible exposure |
| Tight budget and no attribution set up | Fund tracking first, then a small micro pilot | You cannot learn from untagged spend |
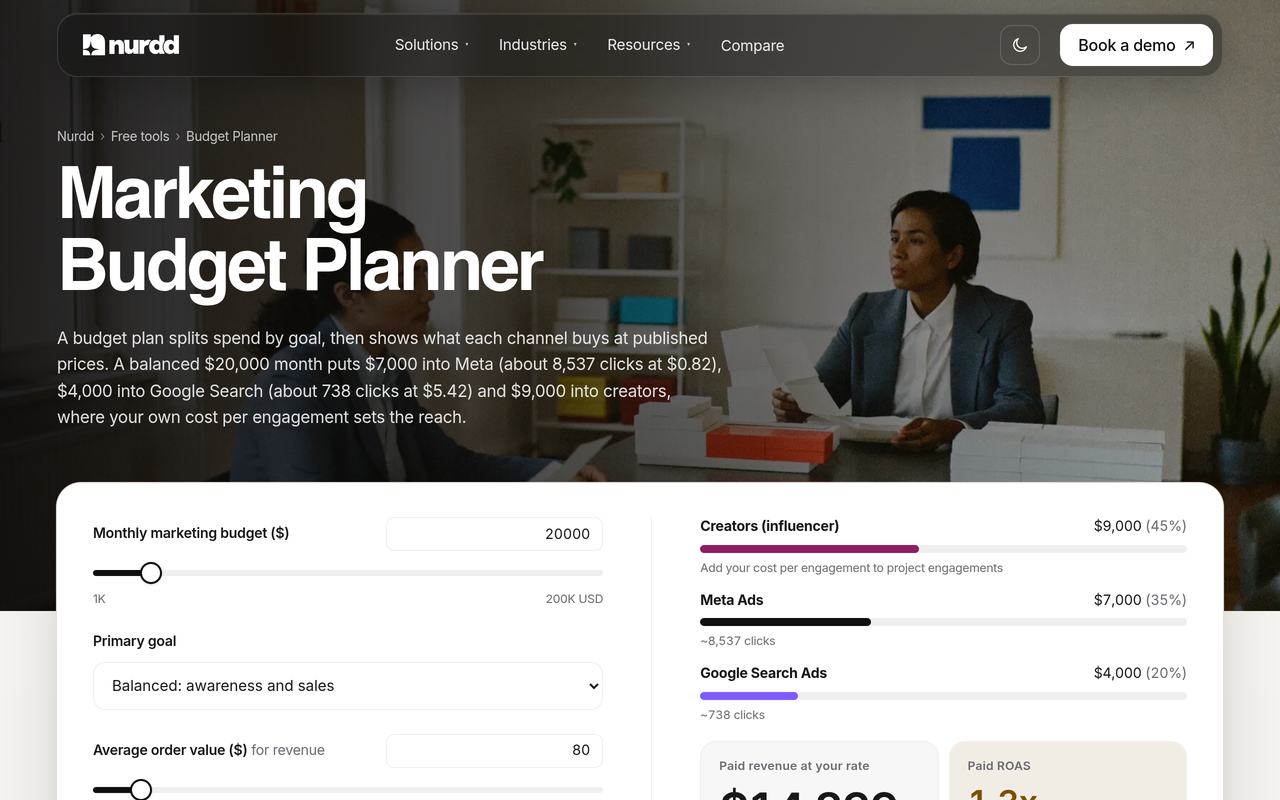
The marketing budget planner splits a budget across creators, Meta and Google, which helps when influencer spend competes with paid media.
Step 6: Vet each creator before paying
Action: run the checklist below on every shortlisted creator. Result: a pass or fail with reasons. Why: engagement can be padded, and a B2B audience full of bots or off-ICP followers has no value.
- Open the follower list sample and comments. Check that commenters have real job titles in your ICP, not generic praise from unrelated accounts.
- Check the engagement rate against the creator's tier using the engagement rate calculator.
- Estimate fake or inactive followers with the fake follower checker, then follow the fake follower audit checklist for anything borderline.
- Read the last 15 sponsored and unsponsored posts. Look for first-hand use of tools, not scripted praise.
- Ask for audience analytics screenshots showing job function, seniority and location.
- Check for competitor conflicts and exclusivity terms in past partnerships.
- Request a short written sample angle that shows how the creator would explain your product to a peer.
Awin's point about authenticity applies here: its brand contacts report that creators who genuinely use a product and show that expertise in their own work outperform creators with broader reach but less first-hand experience. Treat that as one affiliate team's observation, not a controlled result.
Step 7: Pay for outcomes and tag everything
Action: pair a base fee with a bonus on a qualified event, and give every creator a unique tagged link and code. Result: each post connects to trial, demo or lead records. Why: Awin argues that affiliate-style structures suit trusted B2B creators, and tagging is the only way to see which tier did what.
Keep the qualified event strict. A free-trial activation is a weaker trigger than a sales-accepted lead, so decide which one matches your sales cycle before you negotiate. Our UTM structure guide for influencer campaigns shows how to name links so the data stays clean, and the CRM integration guide shows how to carry those tags into your pipeline records.
How do you test your own macro and micro split?
Run a sequential test over eight weeks, so each tier has time to do its job. Macro content plants the name and micro content closes, so measuring both on a same-week last click would hide the macro assist.
| Weeks | Activity | What you record |
|---|---|---|
| 0 to 1 | Tag links, define the qualified event, record baseline branded search, direct traffic and demo volume | Baseline |
| 1 to 3 | Macro or category-voice content goes live | Branded search, direct traffic, ICP-account site visits |
| 3 to 6 | Micro practitioner series goes live | Tagged clicks, trials, demos, comments from ICP accounts |
| 6 to 8 | Review assisted and last-touch results; hold one comparable segment back as a control if volume allows | Assisted conversions, cost per qualified lead |
Then compare the lift in the exposed accounts with the held-back group. Our guides on last-touch vs multi-touch attribution and influencer campaign incrementality explain the maths in more detail. Be honest about the limits: B2B volumes are small, so one cycle will show direction, not proof.
What does a B2B SaaS influencer content mix look like?
Micro practitioners tend to produce tutorials, workflow walk-throughs and honest comparisons. Macro voices tend to produce trend commentary and category framing. Those formats also behave differently in search, because tutorial content can be found long after posting, a point we cover in our guide to social search optimization.

Ask each creator for one asset that gives a buyer a reason to act, such as a template, a benchmark or a recorded walk-through. That asset gives you a clean conversion event to tag and gives the creator something worth sharing.
What are the common mistakes in B2B influencer budgeting?
- Choosing by follower count. A large following with a low ICP share can reach fewer buyers than a small, focused one, as the worked example shows.
- Copying a fixed ratio. A split like 70/30 is a story, not a result; use it only as a hypothesis.
- Judging macro on last click. Awareness content rarely converts on the same visit, so judge it on branded search, direct traffic and assisted conversions.
- Skipping the fake follower check. Inflated audiences distort every number that follows; the audience vetting guide shows what to examine before paying.
- No tracking before launch. Without tagged links you will not know whether a trial came from a tutorial or a commentary post.
- Over-scripting practitioners. Peer trust depends on the creator sounding like themselves.
- Ignoring disclosure. Require clear paid-partnership labelling in every contract, and check the rules in each market where you run campaigns.
How does Nia by Nurdd help with macro and micro creator selection?
Nia by Nurdd is an AI-native creative studio with influencer marketing built in. It searches a database of 10M+ creator profiles across Instagram and other platforms by niche, audience quality, engagement authenticity and brand match score. It scores shortlisted creators for fake followers with TruAI, forecasts expected return before anyone is briefed, and attributes product-level sales to creators afterwards. Nia is priced below comparable plans.
Book a demo at https://www.nurdd.club/demo to see your own shortlist scored on audience quality and forecast return.
Be clear about the fit: Nia covers creators on Instagram and other platforms in its database, so LinkedIn-first practitioners still need the manual vetting checklist above. The influencer discovery software evaluation guide and the best influencer marketing platforms roundup help you check any platform against your channel mix.
If you would rather hand off the work, Nurdd's team also runs creator campaigns on Nia as a managed influencer marketing agency service. For sector context, see the SaaS industry page, and for numbers to benchmark against, the marketing benchmarks hub and the influencer ROI calculator.
What should you do next?
Start with one ICP scorecard, score ten creators, and let the cost per ICP contact make the first cut. Then pair a small macro or category-voice test with a micro practitioner series, tag everything, and read the results after eight weeks. The right split for your brand will come from that data, not from a borrowed ratio.
To see how this works for your own brand, book a demo. You will see a creator shortlist for your category with audience-quality scores, fake follower checks and a forecast return range for your budget.
How we researched this
We reviewed published guides, a trade-press report on LinkedIn research and an affiliate network's market commentary on B2B creator marketing, all checked on the publication date of this post. We read the pages directly and quote only figures that appear on them, naming the original study where the page names one. We did not run campaigns, interview creators or collect customer data, and the budget starting points in Step 5 are our own reasoning, labelled as such. Figures that circulate widely, such as 20:1 and 6:1 ROI or a 23% uplift from a 70/30 split, could not be traced to a primary source, so we left them out.
Frequently asked questions
What is the difference between micro and macro influencers in B2B?
ContentGrip (May 2026) defines micro-influencers as roughly 10,000 to 100,000 followers and macro-influencers as roughly 100,000 to 1 million. In B2B, the difference matters less than the audience: micro creators tend to have concentrated professional audiences, while macro creators offer category-level reach.
Is a 70/30 micro to macro split the right ratio for B2B SaaS?
There is no verifiable source for a universal 70/30 ratio. A better approach is to start from your funnel stage and ICP density, set a testable split, and revise it after an eight-week sequential test.
Do micro-influencers deliver better ROI than macro-influencers for B2B SaaS?
Not reliably in either direction, based on the public evidence we found. ContentGrip reports higher median LinkedIn engagement for micro creators (3.83% against 2.94% overall), but engagement is not ROI. Measure cost per qualified lead and assisted pipeline for your own accounts.
How much do B2B micro-influencers cost?
ContentGrip (May 2026) gives US$300 to US$1,500 per piece of content as a working range for B2B micro creators. Quotes vary by platform, niche and usage rights, so check them against the influencer rate card estimator and ask for audience analytics before agreeing a fee.
How do I measure the effect of macro influencers in B2B?
Use branded search, direct traffic and assisted conversions rather than last click. Tag all links before launch, record a baseline, and compare exposed accounts with a held-back group where you can.
Are LinkedIn creators worth paying for in B2B?
Marketing Week reports that 81% of UK B2B marketers surveyed by LinkedIn say creators increase trust and credibility among decision-makers. Awin (July 2026) notes that LinkedIn launched a Creator Marketplace in Campaign Manager, a sign that platform support for these partnerships is growing.
Can Nia by Nurdd find B2B SaaS creators?
Nia by Nurdd searches 10M+ creator profiles across Instagram and other platforms and scores them for audience quality and fake followers. LinkedIn-first practitioners may need manual vetting, and a demo will show you how your category looks inside Nia.