AI Search Visibility
AI Search Statistics: Which Numbers You Can Safely Cite
Vet any AI search statistic by source, date and method before you cite it, and replace borrowed averages with first-party data on your own brand.
 Simran Rawat1 Nov 202618 min read

You can safely cite an AI search statistic when you can trace it to the original study, see its date and sample, and confirm it measures what your sentence claims. Roundup pages are leads, not sources. For claims about your own brand, first-party data from a tracker such as Noma, which polls 13 AI engines daily, is stronger than any borrowed average.
AI search statistics are safe to cite only when you can trace the number to the original study, read its date, sample and method, and confirm it measures what your sentence says. A figure copied from a roundup fails that test even if it sounds precise. This guide gives you a four-gate check, worked examples with real numbers, and a way to get first-party data on your own brand.
Key takeaways
- Treat every roundup page as a list of leads. Click through to the original study before you repeat any figure.
- Run each number through four gates: source, date, method and claim fit. A number that fails one gate gets softer wording or gets dropped.
- Match the verb to the method. A correlation in keyword data supports the word correlated, not the word caused.
- Averages across the web do not describe your brand. Use first-party data, from Search Console, your analytics and a visibility tracker, for claims about you.
- Record the source, date and sample next to every statistic in a shared sheet so the next writer does not copy it blind.
Why do AI search statistics need vetting at all?
AI search is new, so almost nobody has a long track record of measurement. The result is a large supply of statistics pages, each collecting dozens of figures from other pages. Numbers pass from one article to the next, lose their date and sample on the way, and end up quoted as settled fact.
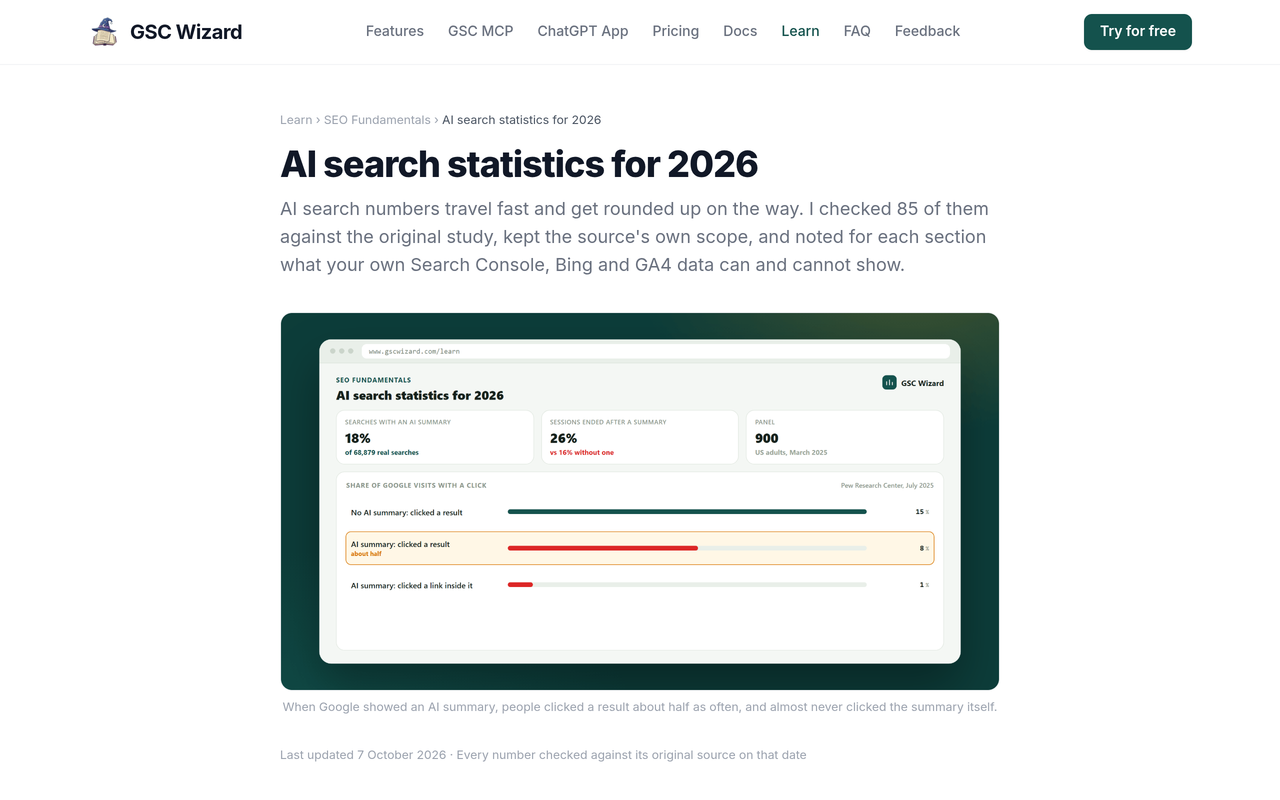
The pages that rank for this topic are mostly dense collections. In October 2026 I reviewed three of them. Superlines publishes a list of 60+ data points plus its own platform research. iPullRank organises adoption, AI Overviews, clicks and referral traffic in a long manual chapter. GSC Wizard lists 85 figures and says each was checked at its original source, and it includes a section on statistics it left out.
Those pages are useful as maps. None of them gives you a repeatable test for deciding which numbers to use in your own deck, or tells you how to replace a borrowed average with data about your own brand. That is the gap this article fills.
What makes an AI search statistic reliable? The four-gate check
A reliable statistic has a named origin, a known date, a disclosed method and a scope that fits your sentence. I use four gates, in this order, because each one is cheaper to check than the next.
- Source gate. Can you reach the original publisher's page, not a page that quotes it? If the chain ends at an unnamed survey or a page that says studies show, the number fails.
- Date gate. When was the data collected, not when the article was published? AI products change quickly, so a figure from one quarter may not describe the next.
- Method gate. Who or what was measured: a browsing panel, a keyword database, a platform's own logs, or a survey? Is the sample size stated? Is the finding a correlation or an experiment?
- Claim-fit gate. Does the population in the study match the population in your sentence? A US panel does not describe a global market, and informational keywords do not describe all searches.
A statistic that passes all four gates can be cited with its source, date and scope in the sentence. One that fails the claim-fit gate can often be rescued by narrowing your wording. One that fails the source gate should be dropped.
Source tiers: how much weight each type deserves
| Tier | What it is | Example in this topic | How to use it |
|---|---|---|---|
| 1. First-party platform documentation | The platform describing its own product or reporting | Google's AI features documentation | Cite for how a product works or what a report counts |
| 2. Independent research with disclosed method | A research body or publisher with a stated sample | Pew Research Center, July 2025 | Cite with the sample and date in the sentence |
| 3. Vendor study with disclosed method | A tool company analysing its own dataset | Ahrefs, April 2025 | Cite with the method and with the vendor's dataset named as the scope |
| 4. Roundup or aggregator page | A page collecting other people's figures | Any 60+ statistics list | Use only to find the original, then cite the original |
The tiers describe weight, not honesty. A vendor study can be rigorous, and a research body can have a narrow sample. What matters is whether the method is on the page so you can judge it.
How do you check an AI search statistic step by step?
Here is the process I would follow for every number before it enters a post, a deck or a client report. Each step has an action, a result and a reason.
Step 1: Find the original publisher
Click through every link in the sentence until you reach a page that contains the data itself, such as a study, a report or a documentation page. The result is either a primary page or a dead end. The reason is that every hop through a roundup is a chance for a number to be rounded, mislabelled or misdated.
Step 2: Write down the collection date
Look for the month the data was gathered, then record it. The result is a date you can put in your sentence, such as March 2025. The reason is that readers and AI engines both treat undated figures as current, and a stale number repeated as current damages your credibility.
Step 3: Read the method section
Find the sample, the population and the measurement tool. The result is one line you can paste beside the number, for example a browsing panel of 900 US adults. The reason is that the method decides what the number can support.
Step 4: Check whether the finding is a correlation or a controlled result
Look for the words correlated with, associated with or compared with. The result is the right verb for your sentence. The reason is that a keyword comparison cannot rule out other causes, and stating a cause you cannot show is the most common way marketers overreach.
Step 5: Test the claim fit
Ask whether your sentence describes the same people, country, platform and query type as the study. The result is either a pass or a narrower sentence. The reason is that a statistic about one platform does not transfer to another.
Step 6: Look for a newer or conflicting study
Search the topic for a re-run or a competing study. The result is either confirmation or a range. The reason is that a single study is a data point, and a range from two independent methods is stronger evidence.
Step 7: Write the citation in full
Put publisher, month and scope in the sentence, and link the original. The result is a claim a reader can check in one click. The reason is that this is also the form an AI engine can quote without distorting it.
Step 8: Log it
Add the figure, link, date, sample and your verdict to a shared sheet. The result is a library your team can reuse. The reason is that the same shaky number tends to return in every new draft unless someone records why it was rejected.
Worked example 1: the AI Overviews click-through number, checked by hand
Few AI search statistics are repeated as often as the claim that AI Overviews cut clicks. Here is what the primary pages actually say, and how the gates apply.
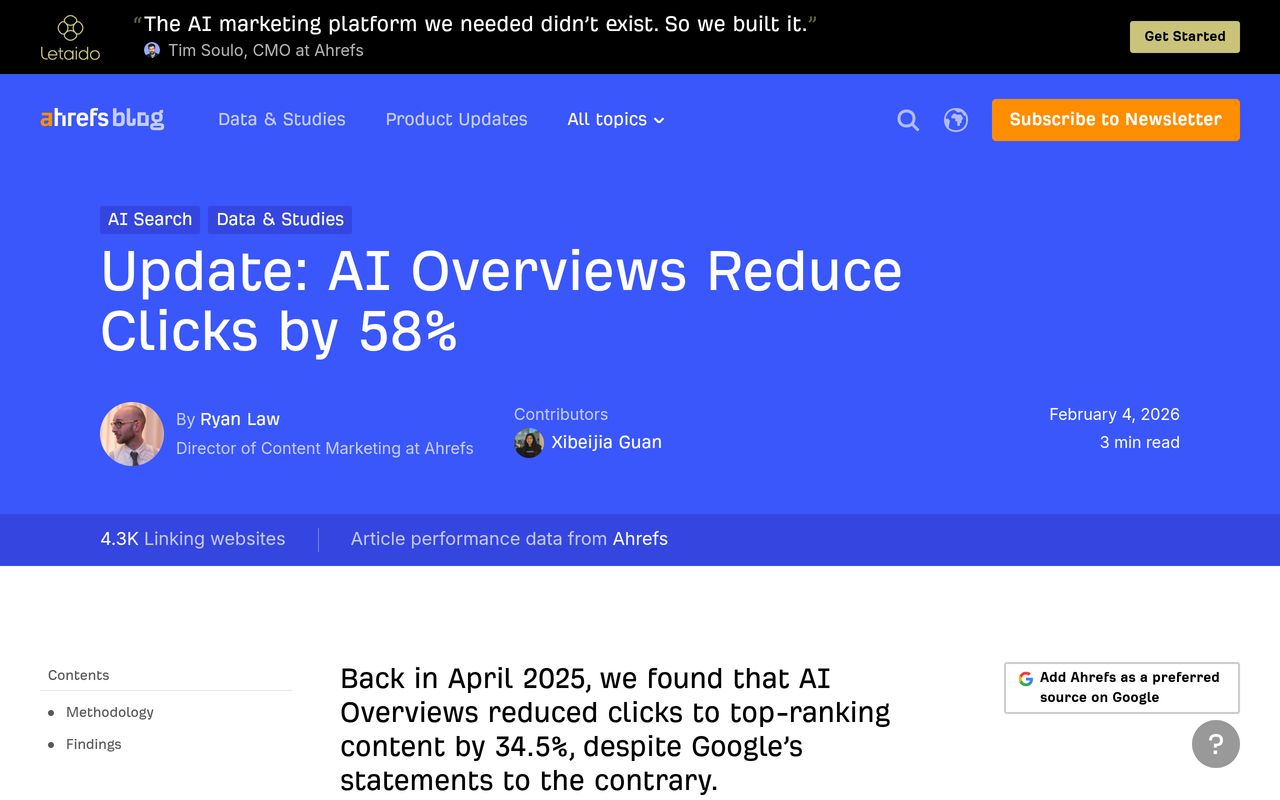
In Ahrefs, April 2025, the team took 300,000 keywords from its Keywords Explorer database: 150,000 with an AI Overview and 150,000 informational keywords without one. It used aggregated Google Search Console data for average desktop click-through rate. For position one, the average on AI Overview keywords fell from 0.073 in March 2024 to 0.026 in March 2025.
The 34.5% figure comes from a forecast, not from a direct before-and-after. Ahrefs scaled the 0.073 starting rate by the drop seen in comparable informational keywords, 0.031 divided by 0.056. That gives a forecast of 0.040. The gap between 0.026 and 0.040 is about 35% lower, which Ahrefs reports as 34.5%.
Ahrefs reported that the presence of an AI Overview correlated with a 34.5% lower average click-through rate for the top-ranking page, based on 300,000 keywords, desktop data and March 2025 figures.
The same team later re-ran the study. Ahrefs, in its update using December 2025 data, found the presence of an AI Overview now correlated with a 58% lower average click-through rate for the top-ranking page, using the same method over a two-year gap.
| Gate | Result for the 34.5% and 58% figures |
|---|---|
| Source | Pass. Both are on Ahrefs' own pages with the method. |
| Date | Pass if you state March 2025 for 34.5% and December 2025 for 58%. Fail if you say current. |
| Method | Pass with limits. Desktop clicks, informational keywords, Ahrefs' keyword sample, and a forecast as the baseline. |
| Claim fit | Narrow. Supports a sentence about top-ranking pages on informational keywords. Does not support a claim about all searches or about mobile. |
A safe sentence would read: in Ahrefs' December 2025 keyword analysis, AI Overviews correlated with a 58% lower average click-through rate for the top-ranking page on informational keywords. An unsafe one would read: AI Overviews cut your traffic by 58%.
Worked example 2: why two honest studies give different answers
The Pew Research Center analysed browsing data from 900 US adults who agreed to share their activity. In Pew Research Center, July 2025, users who saw an AI summary clicked a traditional result link in 8% of visits, against 15% for users who did not. They clicked a link inside the summary in 1% of visits.
Pew also found that 18% of the Google searches in its study produced an AI summary in March 2025. By my own arithmetic, 8% against 15% is a relative drop of about 47%, which is a different measure from Ahrefs' 34.5% and 58% and covers all visits rather than top-ranking pages.
These figures do not contradict one another. One is a share of visits in a browsing panel, the other is a click-through rate for one ranking position in keyword data. Citing them together is fine, as long as the sentence says which is which.
The same caution applies to prevalence. A 2026 roundup on Superlines states that AI Overviews appear on 48% of all Google search queries, while Pew's panel put it at 18% for March 2025. The gap could come from the date, the country, the query mix or the measurement tool, and the roundup line alone does not let you tell which. Until you trace the 48% to its original dataset, you can only cite it as that vendor's claim.
| Question | Pew Research Center (March 2025 data) | Ahrefs update (December 2025 data) |
|---|---|---|
| What was measured | Visits by a panel of 900 US adults | Average desktop click-through rate for position one |
| Sample | 900 US adults sharing browsing data | 300,000 keywords, 150,000 with an AI Overview |
| Headline figure | Link clicks in 8% of visits with an AI summary, 15% without | 58% lower average click-through rate for the top-ranking page |
| Type of claim | Observed behaviour in a panel | Correlation estimated against a baseline |
Worked example 3: the statistic that your own data should replace
Brand-mention statistics are where borrowed numbers mislead most. In January 2026, Search Engine Journal reported on research by SparkToro and Gumshoe.ai. The team ran 2,961 prompts across ChatGPT, Claude and Google's AI in Search with hundreds of volunteers. It tested 12 brand-recommendation prompts, each run 60 to 100 times per platform, and found less than a 1-in-100 chance of getting the same list of brands twice.
The implication matters more than the headline. If the same prompt returns a different brand list almost every time, a single screenshot of your brand appearing or missing proves very little. A trustworthy visibility number comes from many repeated runs over time, expressed as a rate, not from one answer.
It also means that a statistic like brands appear in AI answers X% of the time, quoted from some other category, cannot tell you whether your brand appears. Only repeated sampling of your own prompts can.
Which AI search statistics should you treat with extra caution?
Some figure types fail the gates more often than others. Watch for these patterns when you scan a roundup.
- Headlines without a population. A line saying only 231 of every 1,000 US Google searches send a click to the open web, as in a heading on the iPullRank statistics chapter, modified October 2026, may be well sourced, but you need the underlying study, device mix and date before repeating it.
- User counts with a vague date. The Superlines page states 1.2 billion ChatGPT weekly active users in September 2026. A user count belongs to the company that owns the product, so cite it only after finding the company's own statement.
- Percentages of unspecified items. Is 40% of queries, of citations, of clicks or of sessions? Ambiguous denominators are the most common source of misquotation.
- Vendor platform data presented as the market. A tracker's dataset describes the prompts and brands that tracker follows. That is useful, but it is not a census of AI search.
- Predictions stated as findings. Statements about what adults will do by a future year are forecasts and should be worded that way.
Decision table: cite, soften or drop
| What you found | Decision | Safe wording template |
|---|---|---|
| Primary page, date, sample and method all visible | Cite | In [Publisher]'s [Month Year] study of [sample], [finding]. |
| Primary page found, but narrow scope | Cite with the scope | Among [population], [finding]. Do not generalise. |
| Correlation shown, causation implied | Soften the verb | [Finding] correlated with [outcome]. |
| Only a roundup, no original found | Drop, or attribute to the roundup | [Roundup] reports [figure], but the original study could not be located. |
| Date missing or more than a year old on a fast-moving topic | Soften or find a newer study | As of [data month], [finding]. |
| Your own brand is the subject | Replace with first-party data | In our [month] tracking of [N] prompts, [finding]. |
Where can you find first-party data on your brand in AI search?
First-party data is data you collect or control about your own brand. For AI search, there are four useful sources, and none of them replaces the others.
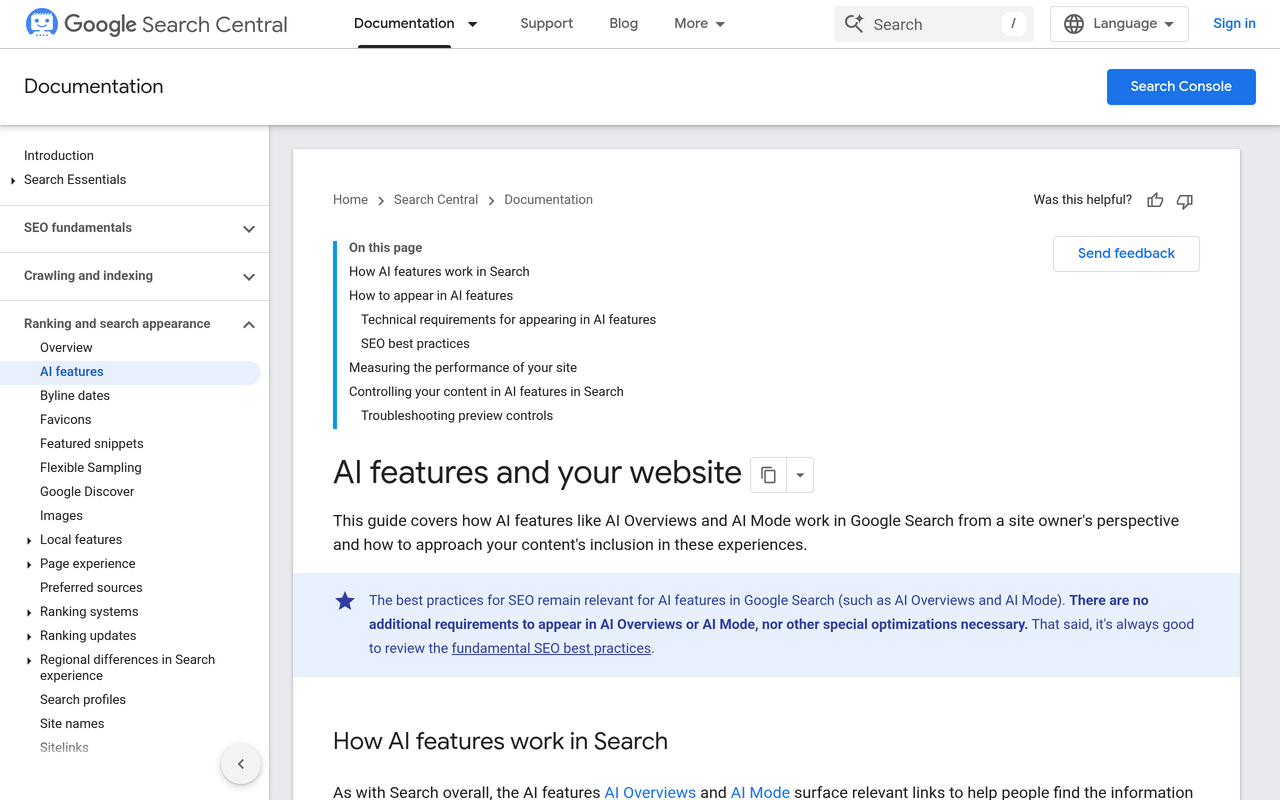
Google's own documentation says sites appearing in AI features such as AI Overviews and AI Mode are included in overall search traffic in Search Console and reported in the Performance report. That makes Google's AI features documentation the primary page to cite for how Google counts that traffic. A practical consequence is that Search Console shows total search performance, not a separate AI-only view you can isolate by yourself.
Your web analytics show visits from AI engines that send referrers, which tells you about clicks but not about answers where your brand was named and nobody clicked. Your sales and customer surveys can add how did you hear about us answers. Neither source shows whether AI engines recommend you when a buyer asks a category question.
That last gap is what a visibility tracker fills. It runs a fixed set of prompts on a schedule, records whether your brand is mentioned or cited, and compares you with competitors. For a method on choosing those prompts, see Which Prompts to Track for AI Search Visibility.
| Question you need answered | Where the first-party answer lives | What it cannot tell you |
|---|---|---|
| How much Google search traffic comes to my site? | Search Console Performance report | A clean split of AI-only clicks |
| Do AI engines send visitors to my site? | Web analytics referral sources | Answers that named you without a click |
| Is my brand mentioned when buyers ask category questions? | A visibility tracker with repeated runs | Why a person chose you in the end |
| How do I compare with competitors in AI answers? | A tracker with competitor comparison | Competitor traffic or revenue |
| How do AI visitors convert? | Analytics plus your order data | Influence from answers that left no click |
How Noma gives you your own numbers across 13 AI engines
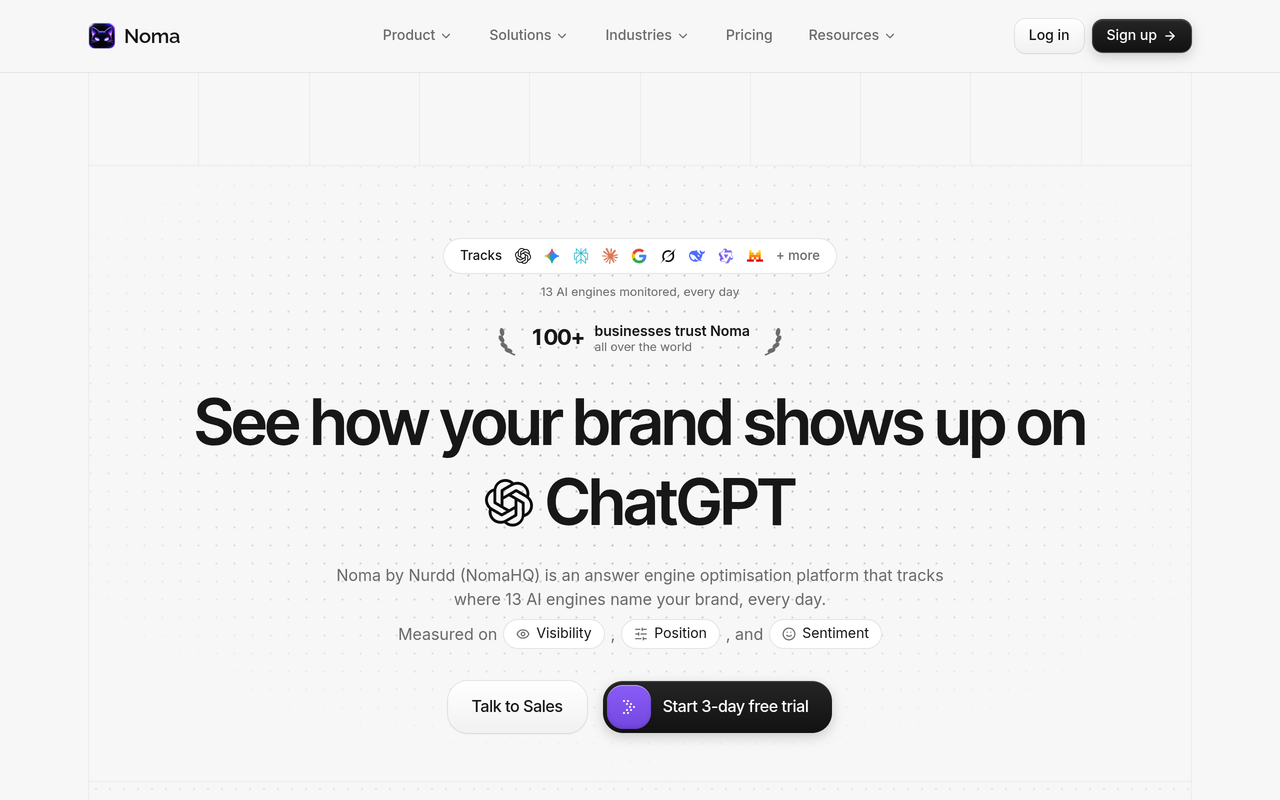
Noma by Nurdd is a web dashboard that tracks whether a brand appears in AI engine answers from 13 AI engines, including ChatGPT, Gemini, Perplexity and Claude, polled daily. It shows citation frequency by category, competitor comparison and recommendations for improving AI visibility. That makes Noma a first-party data source for the question borrowed statistics cannot answer: how often your own brand shows up.
Noma has a 3-day free trial. A card is taken at signup and billing starts on day 3, so you are not charged if you cancel before then. You can look at the product at nomahq.app.
Book a demo at nurdd.club/demo and you will see Noma's view of your own brand and your category, so you can compare it with the industry averages you have been quoting.
How to turn Noma data into a citable statistic
Because one run proves little, as the SparkToro research shows, a statistic built from your own tracking should always state the number of prompts, the period and the engines. A sentence like In our tracking of 40 category prompts over four weeks, our brand appeared in 22% of answers is checkable inside your company and honest outside it. The numbers in that example are placeholders showing the format, not results from any real brand.
Give the figure a denominator and a time window. Then report movement over time, not a single reading. For a weekly routine, see How to Track Your Brand's AI Search Visibility Score Week Over Week and AI Search Share of Voice: How to Measure It.
Checklist: vet an AI search statistic in five minutes
- Copy the number and the sentence it appeared in.
- Open every link until you reach the page holding the data. If none exists, stop and mark it unverified.
- Write the data collection month, not the publication month.
- Write the sample, the country and the tool that measured it.
- Decide whether the result is observed behaviour, a correlation or a forecast, and pick a matching verb.
- Compare the study's population with your sentence. Narrow your sentence if they differ.
- Search for a newer or competing study and note any range.
- Write the citation with publisher, month and scope, then log it in your team's sheet.
- If the claim is about your brand, swap it for first-party numbers.
What are the most common mistakes when citing AI search statistics?
- Quoting the roundup as the source. The roundup is not the researcher. Always link the original.
- Dropping the date. A figure for March 2025 is not a figure for today.
- Turning a correlation into a cause. Keyword comparisons support the word correlated.
- Applying a US panel to every market. Pew's study covers US adults. Say so.
- Using category averages for your own brand. Your visibility depends on your prompts, your competitors and your content.
- Presenting one AI answer as proof. Given the SparkToro finding on varying brand lists, one screenshot is an anecdote.
- Rounding up for effect. If the source says 58%, write 58%, not almost 60%.
Are there alternatives to Noma for first-party AI visibility data?
Yes. Search Console and web analytics are free and should be your baseline, and several suites and visibility tools also track AI answers. The question to ask any tool is the same one this article asks of statistics: how many prompts, which engines, how often, and can you see the raw answers.
If you are weighing options, Best AI Search Visibility Tools in 2026, Compared sets out the criteria, and the pages comparing Noma vs Profound, Noma vs Semrush and Noma vs Ahrefs cover specific tools. Noma's case is that it tracks 13 AI engines daily and focuses on your brand's own citation frequency and competitor position.
How do you use vetted statistics in content that AI engines quote?
Vetted figures help your own pages get quoted. A sentence with a named publisher, a month, a sample and a finding is one an AI engine can lift without losing meaning. Compare that with a vague line such as studies show AI search is growing, which gives an engine nothing to attribute.
Put the statistic in a short paragraph or a table row, name the entity in full, and link the primary page. The pages on the sentence structure that gets cited and writing website content AI engines quote show how. For a wider view of the discipline, read What is Generative Engine Optimization (GEO)?, and for a quick self-check use the free GEO readiness scorecard.

How we researched this
I reviewed three ranking pages for the primary keyword: Superlines, iPullRank and GSC Wizard. I noted their structure and what they leave out. I then read the primary pages for the figures used as examples: Pew Research Center, two Ahrefs studies, Google's documentation and Search Engine Journal's report on the SparkToro and Gumshoe.ai study.
All pages were checked on the publication date of this article, and every figure is quoted as the source states it. Calculations marked as mine are my own arithmetic from published numbers. I did not run my own experiments, interview anyone or use customer data. Product facts about Noma come from Nurdd's own product information.
Related reading on nurdd.club
- AI Search Visibility Benchmarks by Category for published research on category-level numbers.
- How to Track Google AI Overviews for Your Brand for the Google side of measurement.
- Does AI Search Traffic Convert Better Than Google? for a claim that needs the same vetting.
- AEO Audit Checklist for D2C Brands for the content side.
- Nurdd's free marketing tools for quick calculators.
Frequently asked questions
How do I check whether an AI search statistic is reliable?
Trace it to the original study, then check its date, sample and method. Confirm that the population in the study matches your sentence. If you can only find the number on roundup pages, treat it as unverified.
Where can I find first-party data on my brand in AI search?
Use Search Console for Google traffic, web analytics for AI referral visits and a visibility tracker for mentions and citations. Noma tracks 13 AI engines, including ChatGPT, Gemini, Perplexity and Claude, polled daily, and shows citation frequency and competitor comparison for your brand.
Is a statistics roundup a valid source?
It is a valid starting point but not a source for the figure. Use it to find the original publisher, then cite that page. Even roundups that say they checked their numbers can drop the date or scope.
Why do different studies report different numbers for AI Overviews?
They measure different things. Pew analysed a panel of 900 US adults and found 18% of searches produced an AI summary in March 2025, while keyword-database studies and vendor roundups use other samples, dates and query types. Always compare the method before comparing the number.
Can I say AI Overviews reduce clicks?
You can say that studies found a correlation. Ahrefs reported a 58% lower average click-through rate for top-ranking pages, using December 2025 data, and Pew found link clicks in 8% of visits with an AI summary versus 15% without. State the method, since neither is a controlled experiment on your site.
How often should I refresh the AI search statistics in my content?
Review them at least every quarter, and whenever a platform announces a major change. Replace the figure with the newer study if one exists, or add the data month so readers can judge freshness.
Why can't I trust one ChatGPT answer about my brand?
Because answers vary between runs. The SparkToro and Gumshoe.ai research reported a below 1-in-100 chance of getting the same list of brands twice for the same prompt. A rate measured over many runs is a more honest figure than one screenshot.
Do I need a paid tool to get first-party AI visibility data?
Search Console and analytics are free and cover clicks. Answers where your brand is named without a click need a tracker that repeats prompts. Noma offers a 3-day free trial with a card taken at signup, billing from day 3.
Next step: see your own AI search numbers
Borrowed statistics describe other people's brands. Book a demo of Noma and see your own brand's mentions and citations across 13 AI engines, how you compare with competitors, and the actions Noma recommends. You can also start from the GEO readiness scorecard or read why your brand may not be showing up in ChatGPT answers.