AI Search Visibility
AI Search Visibility Dashboard: What Executives Need to See
An executive AI search visibility dashboard needs four views: share of voice, citation sources, sentiment and trend by engine. Here is what to show and skip.
 Simran Rawat3 Nov 202618 min read

An AI search visibility dashboard for executives should show four views: share of voice against named competitors, the sources that AI engines cite, sentiment in the answers, and the trend by engine on a fixed prompt set. Leave out raw mention counts, single-run screenshots and blended scores nobody can reproduce. Noma by Nurdd tracks 13 AI engines, including ChatGPT, Gemini, Perplexity and Claude, polled daily, and covers part of these views with citation frequency by category and competitor comparison.
An AI search visibility dashboard for executives should answer three questions on one screen: are we being named, are we winning against the competitors leadership cares about, and which sources are shaping the answers. Four views cover this: share of voice, citation sources, sentiment, and trend by engine. Everything else is supporting detail.
Most dashboards fail because they show everything the tool can measure. A leadership report needs the few numbers that change a decision, a fixed method behind them, and a plain note on what to do when one moves. This guide defines those views, explains what Noma shows toward them, and lists the vanity numbers to leave out.
Key takeaways
- Build four views, not forty: share of voice, citation sources, sentiment, and trend by engine.
- Fix the prompt set, the competitor list and the engines before the first report. A dashboard that changes its denominator cannot show a trend.
- Report share of voice as the headline and visibility as context, because one says whether you are winning and the other only whether you are present.
- Drop single-run screenshots, raw mention counts and blended scores that nobody can reproduce.
- Pair visibility with one business number from analytics, and label AI-influenced revenue as directional.
- Review the report monthly for leadership and weekly for the working team.
What should an AI search visibility report include?
An executive report should include only the metrics that answer a question leadership actually asks. Semrush frames those questions as three: are we visible, how do we compare, and does it matter to the business (Semrush, September 2026). The four views below map onto the first two and give you a bridge to the third.
| View | Question it answers | Headline number | Who acts on it |
|---|---|---|---|
| Share of voice | Are we winning against the competitors we named? | Our share of all brand mentions across the fixed prompt set | CMO, product marketing |
| Citation sources | Which pages and domains do engines trust when they answer? | Share of citations pointing to our own pages, plus the top third-party domains | Content, PR, SEO |
| Sentiment | How are we described when we are named? | Balance of positive, neutral and negative framing, plus the top themes | Brand, comms |
| Trend by engine | Is it improving, and where? | Share of voice per engine, week over week, on the same prompts | Everyone, in the monthly review |
The reason for four is practical. Each view has a different owner and a different next action, so an executive can read the page, pick one problem and assign it. A fifth view that nobody owns is noise.
Why do most AI visibility dashboards fail executives?
They fail because they were built for analysts. A working team needs prompt-level detail, but a leadership audience needs a trend it can trust and a comparison it can repeat next month. When a dashboard mixes both, the executive sees dozens of widgets and cannot tell which one matters.
Three problems recur. The first is a moving denominator: the prompt set, engines or competitors change between reports, so a rise in the line may be a change in method. The second is blended scores: a single index that combines mentions, position and sentiment looks tidy but cannot be explained in a meeting. The third is missing context: a number with no comparison and no recommended action invites the question "so what?"
LLM Pulse's KPI guide argues a monthly report needs about six numbers, each with a defensible formula and a fixed denominator. It is a good test for any dashboard you build.
The test is simple: if you cannot state the formula and the denominator in one sentence, the number does not belong in front of leadership. The same logic applies to client reports at agencies, where the reader changes but the need for a repeatable method does not (LLM Pulse).
What do the leading dashboards already show?
The main vendor pages show a shared core and a few differences in packaging. The core is share of voice, sentiment, citations and a competitor comparison. The differences are mostly in how reports are saved, shared and tied to analytics.
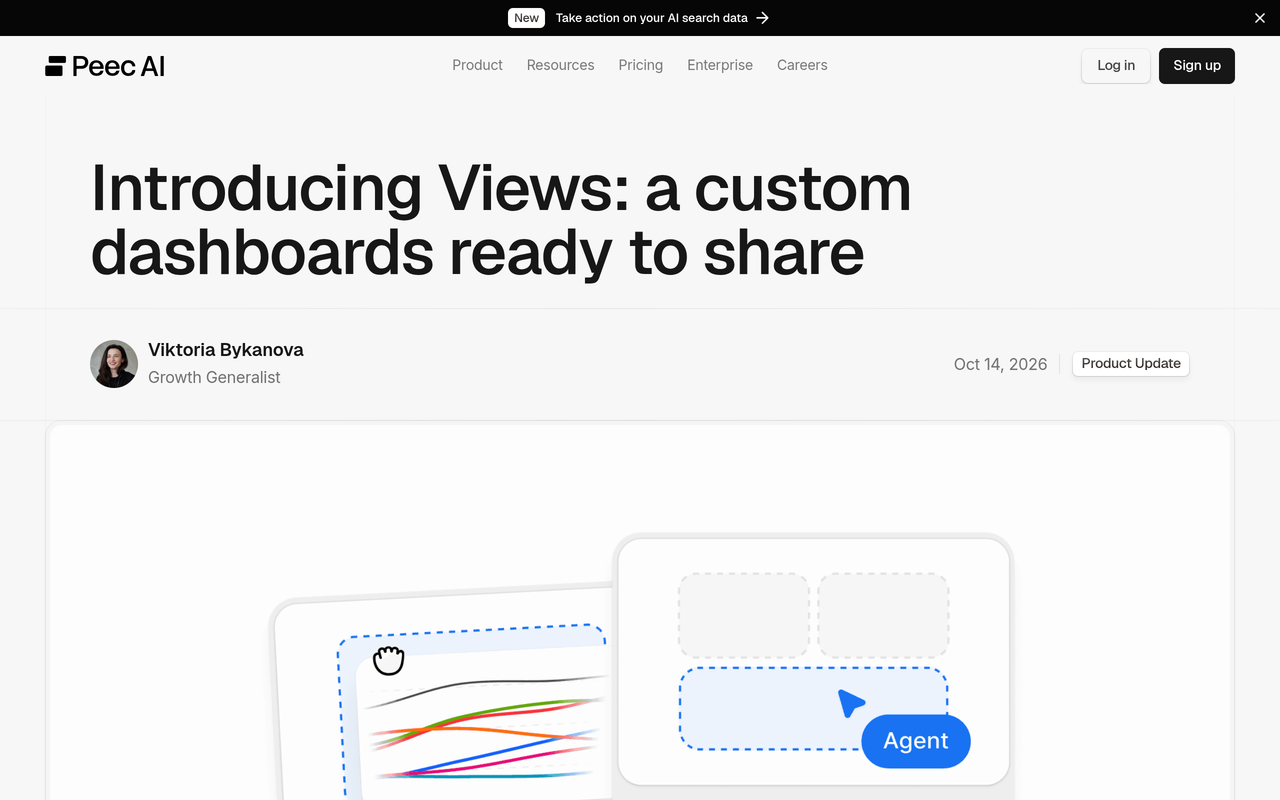
- Peec AI introduced saved dashboards called Views in October 2026. A view has its own name, description and layout, and Peec lists 80 widgets to choose from. Views can be shared with a team, or through a public read-only link with an optional password (Peec AI, October 2026).
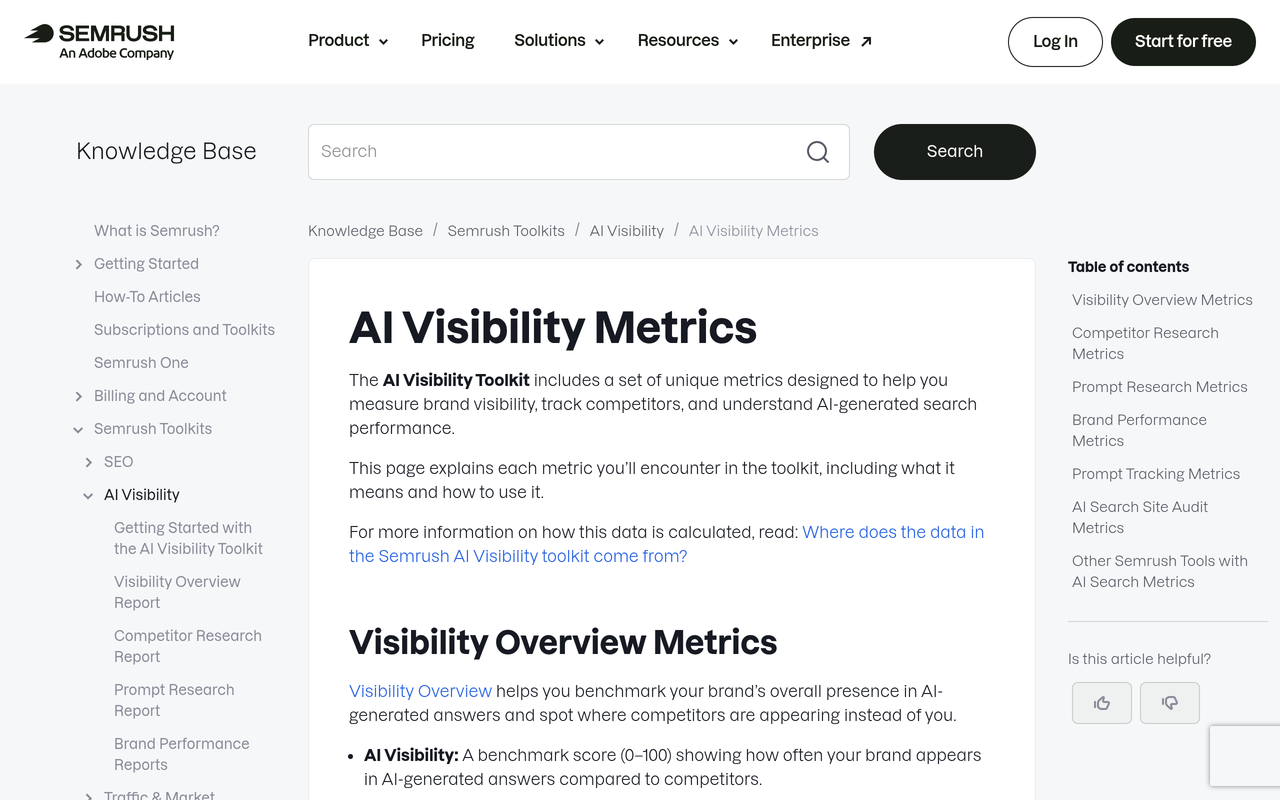
- Semrush defines share of voice as the percentage of mentions a brand receives in AI answers compared with competitors, and treats sentiment and cited pages as separate metrics. Its Brand Performance reports update weekly across Google AI Overviews, AI Mode, ChatGPT, Perplexity and Gemini (Semrush Knowledge Base).
- Profound describes a baseline of visibility score, share of voice and average position, where the visibility score is the percentage of tracked responses that mention the brand (Profound).
- Botify states that its AI Visibility dashboard builds prompts from first-party data, and ties part of its set to Google Search Console keywords (Botify Support).
- Bing Webmaster Tools added an AI Performance dashboard in March 2026 that shows which URLs are cited in generative answers and how citation activity changes over time, including grounding queries (Microsoft Advertising, March 2026).
What these pages do not give you is a rule for deciding what to leave out, a fixed definition of each view that a leadership team can sign off, or a worked example of how to read the numbers. The sections below add those.
How do I build an executive AI search visibility dashboard? A seven-step checklist
Follow these steps in order. Each is an action, a result and a reason, and later steps depend on the method fixed in earlier ones.
- Agree the three questions with leadership. Write down what the executive team will decide using this report, for example whether to fund more content, PR or product-page work. The result is a one-line purpose for the report. This gives you a reason to drop any metric that does not serve it.
- Lock the competitor set. Choose three to six named competitors that leadership already benchmarks against, and keep them for at least a quarter. The result is a stable comparison group. Share of voice is relative, so changing the group changes the number even when nothing else moved.
- Build a fixed prompt set by intent. Split prompts into category questions ("best X for Y"), comparison questions and problem questions, and keep branded prompts in a separate group. The result is a repeatable sample. Without it you are measuring your prompt writing, not your visibility. The guide to which prompts to track for AI search visibility covers how to choose them.
- Choose the engines and keep them. Track the engines your buyers use, and report each separately before you report a total. The result is a per-engine trend. Engines differ in what they cite, so a blended line can hide a drop on one engine behind a rise on another.
- Set the four views and their formulas. Write each formula on the page: mentions of us divided by mentions of all tracked brands, citations to our domain divided by all citations, and so on. The result is a dashboard that can be audited, which stops arguments about definitions in the meeting.
- Add one business number. Pair the visibility views with a single metric from analytics, such as referral sessions from AI engines or conversions from those sessions, and label it directional. Semrush notes that AI attribution is hard, recommends directional metrics, and suggests a self-reported "how did you hear about us" option to catch AI-influenced conversions that never show up as referrals (Semrush, September 2026).
- Attach an action to every view. For each headline number, write what the team will do if it rises, falls or stays flat. The result is a report that ends in decisions; without this step the dashboard becomes a scoreboard.
If you do not yet know where your site stands, run the free GEO readiness scorecard. It is a 12-factor check that gives you a baseline to discuss before the first tracked report exists.
What is the share of voice view, and how should it look?
Share of voice is the percentage of brand mentions in AI answers that go to your brand compared with the competitors you track. Semrush defines it in these terms (Semrush Knowledge Base). It is the headline view because it tells leadership whether the brand is winning, not just whether it appears.
Show it as a ranked bar or a line with your brand and the named competitors on the same axis. Add the visibility figure beside it for context. LLM Pulse makes the distinction clearly: visibility answers whether you are present, and share of voice answers whether you are winning (LLM Pulse). For the full method, see AI search share of voice: how to measure it.
How to read it
- If your share rises while the category total is flat, you are taking ground from a named rival. Check which one lost.
- If your share is flat while a competitor rises, someone is publishing or earning citations you are not. Look at the citation view next.
- If visibility is high but share of voice is low, you are named but not first. That is a positioning and content-structure problem, not an awareness problem.
What is the citation sources view?
The citation sources view shows which pages and domains AI engines link or attribute when they answer your tracked prompts. It explains why the share of voice moved. Bing's AI Performance dashboard makes the same point from the publisher side: it lists which URLs are cited and surfaces the grounding queries behind them (Microsoft Advertising, March 2026).
A good executive version has two panels. The first shows your own pages that were cited, ranked by frequency. The second shows third-party sources cited in answers where you were absent, grouped by type: media, review sites, forums, competitor sites and directories. The second panel is the one executives act on, because it names where the brand should be present and is not. Check what your chosen tool supplies for this view before promising it to leadership.

For the content side of the fix, the guide on why AI search engines trust some websites more than others explains what makes a source citable, and why your competitor is getting cited in AI answers walks through diagnosing a specific gap.
What is the sentiment view?
The sentiment view shows how engines describe the brand when they name it, and which themes drive that tone. Semrush separates overall sentiment from key sentiment drivers, the themes behind positive or negative perceptions (Semrush Knowledge Base). HubSpot adds the reason it matters: negative framing can suppress engagement even when the brand is visible (HubSpot).
Do not show sentiment as a single score alone. Show the split, then list the top three positive and top three negative themes with an example answer for each. An executive can act on "engines say we are expensive for small teams" and cannot act on a bare score.
Treat sentiment as a supporting view for most brands. It moves up to a main view when a brand has a reputation issue, a product recall, a pricing change or a new competitor that engines compare it with.
What is the trend by engine view?
The trend view plots share of voice for each engine over time on the same prompt set. It answers "is this improving?" and "where?" Report each engine as its own line before any combined line, because engines retrieve and cite differently and a blended number can mask a loss.
Noma tracks 13 AI engines, including ChatGPT, Gemini, Perplexity and Claude, polled daily. For a leadership report, group them rather than showing 13 lines: for example, chat assistants and search-integrated engines, with a drill-down for the working team. For context on how the engines differ, see Perplexity vs ChatGPT vs Gemini: which AI engine matters most and how to track Google AI Overviews.
| Trend pattern | What it usually means | First check |
|---|---|---|
| Up on one engine, flat elsewhere | A page or source is being picked up by that engine only | Citation view, filtered to that engine |
| Down on all engines at once | A change on your side, such as a site migration, removed page or changed copy | Site changes in the same week |
| Down on one engine, others steady | That engine changed its retrieval or a competitor gained a source there | Competitor citations on that engine |
| Noisy line with no direction | Too few prompts, or answers vary run to run | Prompt count and sampling frequency |
Which vanity numbers should you leave out?
Leave out any number that cannot be reproduced, compared or acted on. The table lists the common ones and what to show instead. The principle echoes Semrush's report guidance, which advises avoiding vanity metrics and focusing on a small set tied to revenue, demand or brand visibility (Semrush, September 2026).
| Vanity number | Why it misleads | Show instead |
|---|---|---|
| Total mentions this month | Rises when you add prompts, even if nothing improved | Share of voice on a fixed prompt set |
| A screenshot of one good answer | Answers vary between runs, so one capture proves little | Visibility rate over repeated runs |
| A single blended "AI score" | Hides which input moved and cannot be defended in a meeting | Four named views with written formulas |
| Branded-prompt visibility as the headline | Buyers who already know you will mention you; it says nothing about discovery | Non-branded category prompts, reported separately |
| Number of engines tracked | Coverage is a feature, not a result | Per-engine share of voice |
| Backlink count in the AI report | A supporting input, not an AI outcome | Cited pages and third-party sources |
| Absolute AI referral sessions with no context | Often small next to organic and easy to misread as failure | Conversion rate and revenue from those sessions, labelled directional |
Before quoting any market-wide AI search statistic in a leadership deck, check where it came from. The article on AI search statistics you can safely cite explains how to vet them.
What does Noma show toward these views?
Noma is a web dashboard that tracks whether a brand appears in answers from 13 AI engines, polled daily. It shows citation frequency by category, competitor comparison and recommendations for improving AI visibility. Those documented outputs cover part of the executive views, and some views need other inputs.
| Executive view | What Noma documents | Note |
|---|---|---|
| Share of voice | Competitor comparison and citation frequency by category | Agree your formula and competitor list before reading it |
| Citation sources | Citation frequency by category | This is a category view, not a per-domain list; confirm source detail in a demo |
| Sentiment | Not listed as a Noma output | Review answer framing yourself or confirm in a demo |
| Trend by engine | Daily polling across 13 engines | Use the daily data to pick weekly or monthly points |
| Actions | Recommendations to improve AI visibility | Use the top recommendations for your decision slide |
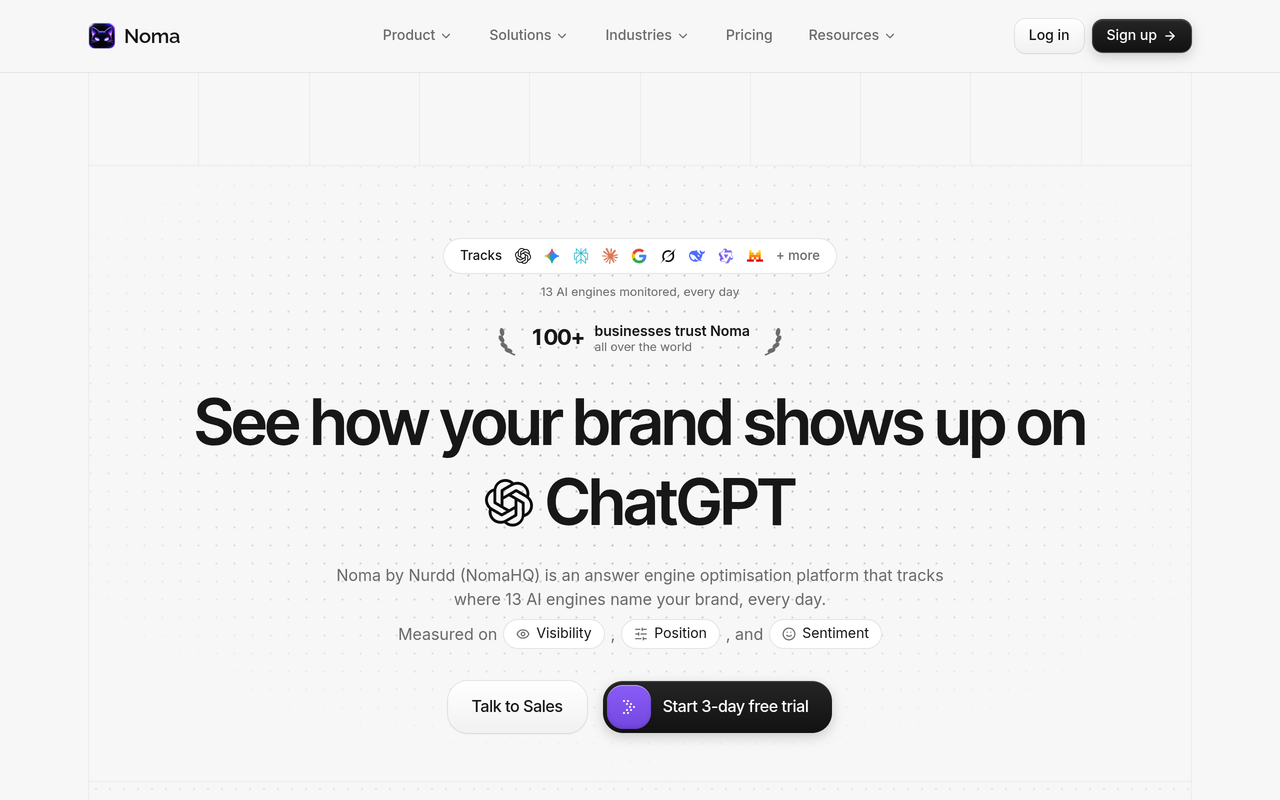
Noma by Nurdd is built for brands that want to know whether AI assistants recommend them when buyers ask category questions. It tracks 13 AI engines, including ChatGPT, Gemini, Perplexity and Claude, polled daily, and shows citation frequency by category, competitor comparison and recommendations. That gives a leadership team a daily, automated base for several of these views instead of screenshots collected by hand.
Book a demo to see how Noma tracks your brand across 13 AI engines: book a demo. Setup specifics for your account are best covered there.
Noma has a 3-day free trial. A card is taken at signup and billing starts on day 3; cancel before then and you are not charged. You can start at nomahq.app. If you are choosing between tools, Noma vs Peec AI, Noma vs Profound and Noma vs Semrush set out the differences.
What does a worked example look like?
The numbers below are illustrative, chosen to show the arithmetic. They are not Nurdd data and not a real brand's results.
Suppose a project tracks 100 non-branded category prompts on four engines, giving 400 answers per period. In month one, the answers name tracked brands 900 times in total. Your brand is named 135 times, so your share of voice is 135 divided by 900, which is 15 percent. Visibility is the share of the 400 answers that name you at all. If you appear in 100 of them, visibility is 25 percent.
In month two, the same 400 answers name tracked brands 1,000 times, and your brand is named 140 times. Your mentions rose, but your share of voice is 140 divided by 1,000, which is 14 percent. A headline of "mentions up" would be accurate and misleading. The share of voice view shows that the category grew faster than you did, and the competitor comparison shows who took the difference.
- Read the headline: share of voice fell from 15 to 14 percent on a fixed prompt set.
- Open the trend by engine: find the engines where the share fell.
- Open the citation view for those engines: find the sources cited in answers where you were absent.
- Assign the action: earn a place on the listed source or update the page it cites.
- Recheck in the next report on the same prompts.
That reading path is the reason the dashboard has four views and not one. Each view answers the question the previous view raised.
How do I report AI search performance to executives?
Report it on a fixed cadence, in a fixed order, with one decision requested. A one-page monthly report works for most leadership teams, with a weekly working view for the team that acts on it. HubSpot recommends repeat sampling rather than one-off screenshots, and monthly tracking (HubSpot).
Use this page order:
- Headline: share of voice versus named competitors, with the change from last period.
- Where it moved: trend by engine, grouped.
- Why it moved: top cited sources, ours and third-party.
- How we are described: sentiment split and top themes.
- Business link: one analytics number, labelled directional.
- Decision requested: one action, one owner, one date.
For agencies reporting to clients, the same structure works with one saved report per client. Peec's announcement lists a client report view that combines visibility trend, a performance matrix, source impact, recommended actions and total impact, a useful pattern to borrow regardless of tool (Peec AI, October 2026). If you would rather hand the work over, the answer engine optimization agency service runs the programme and measures it in Noma.
How should the dashboard differ by audience?
Different audiences need different cuts of the same data. Peec's own examples assign views to content teams, SEO and web teams, brand teams, product marketing, leadership and agencies. The table applies the same idea to the four views.
| Audience | Lead with | Cadence | Depth |
|---|---|---|---|
| CEO or board | Share of voice versus competitors; one business number | Quarterly | One slide |
| CMO | Share of voice, trend by engine group, decision requested | Monthly | One page |
| Brand and comms | Sentiment themes and example answers | Monthly | Two pages |
| Content and SEO | Citation sources, prompt-level gaps, per-engine trend | Weekly | Full dashboard |
| Agency client | Share of voice, wins since last report, next actions | Monthly | One page plus appendix |
Industry context also shapes which view leads. A beauty brand may care most about sentiment themes, a software company about comparison prompts and citation sources. The beauty, ecommerce and SaaS pages show how those categories use AI search visibility.
What are the common mistakes?
- Changing the prompt set mid-quarter. The trend then reflects your edits. Version the prompt set and annotate any change on the chart.
- Reporting one run. Answers vary, so a single run can show a gain or loss that disappears on the next. Use repeated samples and report the rate.
- Mixing branded and non-branded prompts. Branded prompts inflate visibility. Keep them in a separate group.
- Showing 13 engine lines to the board. Group them for leadership and keep detail for the working team.
- Promising revenue attribution. AI-influenced revenue is directional. Say so, and use self-reported attribution to supplement referral data.
- Ending without an action. Every report should name one change before the next one. The AEO audit checklist is a good source of candidates.
How should you tie visibility to business results?
Link visibility to one or two business numbers and be honest about the gap. Referral sessions from AI engines are measurable in analytics, but many people see a brand in an AI answer and visit directly later. Semrush's suggestion of a self-reported option on forms is a low-cost way to catch some of that (Semrush, September 2026).
Compare conversion quality, not only volume. The article on whether AI search traffic converts better than Google shows how to frame that comparison, and the D2C measurement framework shows where AI search sits alongside paid and creator channels. For benchmarks, see AI search visibility benchmarks by category.
How we researched this
The sources are public vendor and platform pages, documentation and blog posts from Semrush, Peec AI, Profound, Botify, HubSpot, LLM Pulse and Microsoft Advertising. We did not test these tools hands-on, and the worked example uses illustrative numbers, labelled as such. Statements about Noma come from Nurdd's own product facts.
Frequently asked questions
What should an AI search visibility report include?
It should include share of voice against named competitors, the sources AI engines cite, sentiment in the answers, and the trend by engine on a fixed prompt set. Add one business metric from analytics, labelled directional, and one recommended action. Anything beyond that belongs in a working dashboard, not the leadership report.
How do I report AI search performance to executives?
Use a one-page monthly report with a fixed order: headline share of voice, where it moved, why it moved, how the brand is described, the business link and one decision. Keep the prompt set, engines and competitors constant so the trend can be trusted. Write each formula on the page.
What is the most important AI search visibility metric?
Share of voice is the strongest headline metric because it shows whether the brand is winning against competitors, not just present. Visibility rate is useful context beside it. Report both on a fixed set of non-branded prompts, and keep branded prompts separate.
How often should an AI search visibility dashboard be updated?
Data can refresh daily or weekly depending on the tool, but report to leadership monthly or quarterly. Noma polls its 13 AI engines daily, so you can take weekly points for the working team and a monthly summary for executives. Reviewing too often makes normal answer variation look like a trend.
Should I include sentiment in an executive report?
Yes, as a short panel rather than a lead metric. Show the positive, neutral and negative split with the top themes and one example answer for each. Promote it to a main view when there is a reputation issue or a competitor that engines compare you with.
How do I connect AI visibility to revenue?
Pair the visibility views with referral sessions and conversions from AI engines in analytics, and add a self-reported "how did you hear about us" option to catch AI-influenced visits that arrive later through other channels. Describe the result as directional, because attribution from AI answers is incomplete.
Can I share an AI visibility dashboard with clients or the board?
Some tools support sharing. Peec AI offers public read-only links with an optional password, for example. Whatever tool you use, share a fixed-format report with the method written on it, and confirm sharing options in a demo before you commit.
How many prompts do I need to track?
There is no fixed number that suits every brand. Use enough prompts per intent group that one odd answer does not move the line, keep the set stable, and add prompts only at planned review points. The guide on which prompts to track helps you choose them.
Conclusion
An executive AI search visibility dashboard works when it is small, fixed and tied to a decision. Four views, share of voice, citation sources, sentiment and trend by engine, cover the questions leadership asks, and a short list of dropped vanity numbers keeps the page honest. For more on the wider field, read what generative engine optimization is and the comparison of AI search visibility tools.
Ready to see how Noma tracks your brand across 13 AI engines? Book a demo and walk through what it shows for your own brand.