AI Search Visibility
GEO Experiment Design: How to Test AI Visibility Changes
A geo experiment tests one content change against a fixed prompt set, a baseline and a control, then re-measures across engines to separate signal from noise.
 Sheetal Shakshi3 Nov 202618 min read

To run a GEO experiment, fix a set of prompts, measure a baseline over several days, change one page, wait for the engines to pick it up, then re-measure the same prompts across several engines. Because AI answers vary from run to run, compare average presence rates against a control group of untouched pages, not single screenshots. Noma by Nurdd supplies the repeated daily measurements across 13 AI engines that this design needs.
A geo experiment is a controlled test of whether one deliberate change to your content moves how often AI engines mention or cite your brand. To run one, fix your prompts, record a baseline over several days, change a single page, wait, and re-measure the same prompts on the same engines against a control. Anything less is a screenshot, not evidence.
This guide sets out a simple design you can run with a small team: how to choose prompts, how long a baseline should be, what to change, how long to wait, and how to read the result when AI answers are noisy. It also includes a worked planning example, a decision table for reading results and a checklist you can copy. If you are new to the field, start with what generative engine optimization is, then come back.
Key takeaways
- Change one page (or one element) per test, and keep a control group of similar pages you do not touch.
- Measure a baseline for several days before the change. A single run tells you almost nothing, because AI answers differ from run to run.
- Judge results by presence rate across many runs and engines, not by one answer or by a rank position.
- Pre-write your decision rule (what counts as a win) before you look at the data.
- Wait for indexing and retrieval to catch up, then re-measure on the same prompts, engines and locale.
- Log every other change (PR, product launches, competitor news) so you can explain a movement that was not your test.
Why does a geo experiment need a special design?
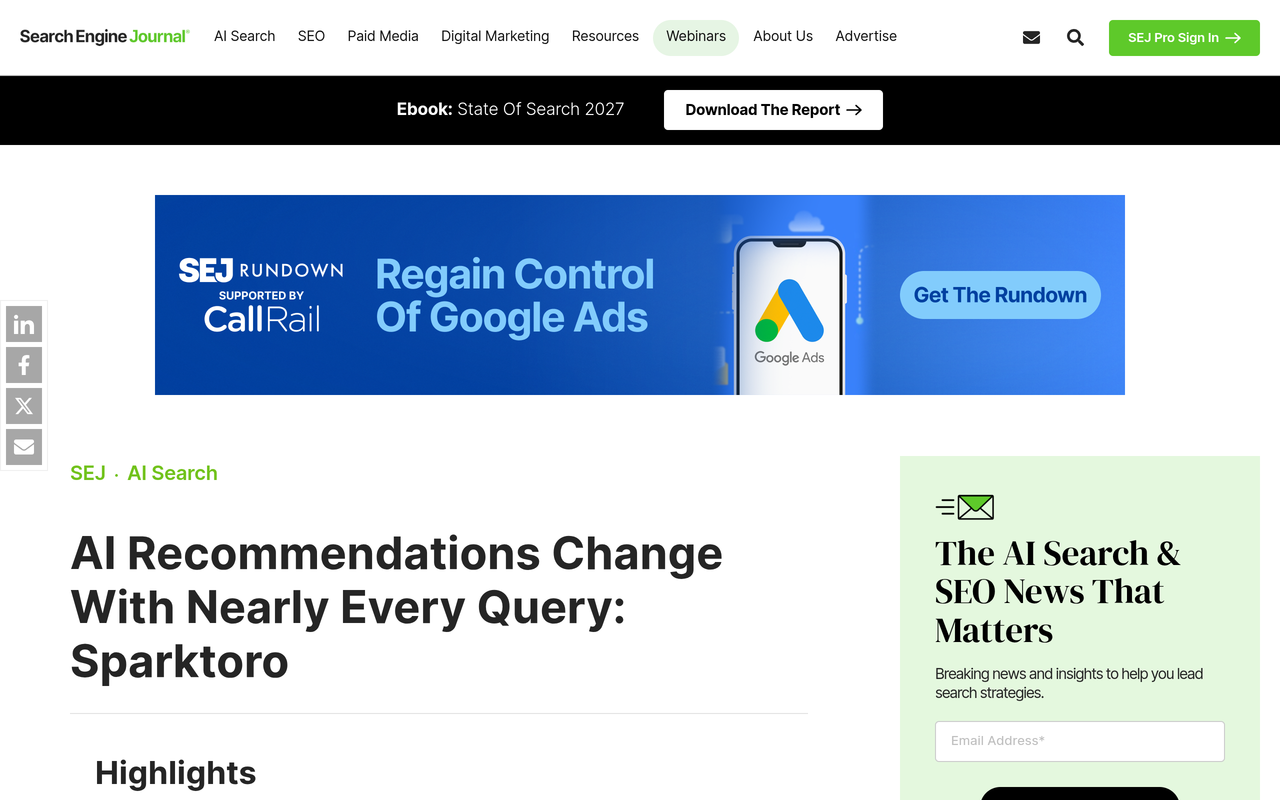
AI engines do not return the same answer twice. SparkToro's research, reported by Search Engine Journal, January 2026, found less than a 1-in-100 chance that ChatGPT or Google's AI in Search would return the same list of brands across repeated runs of the same prompt. The same list in the same order appeared less than 0.1% of the time.
That one finding explains why ordinary before-and-after checks fail. If you change a page on Monday, ask ChatGPT on Friday and see your brand listed, you have learned very little: the brand might have appeared on Monday too, on a different run. The reverse also holds: a missing mention after a change does not prove the change failed.
SparkToro ran 12 brand-recommendation prompts, each 60 to 100 times per platform, and found nearly every response was unique in the brands listed, their order and the number of items. (Source: Search Engine Journal, January 2026.)
The same coverage points to a way out. Although individual lists varied, how often a brand appears across many runs of similar prompts was more consistent than its position. For the headphone prompts, four brands appeared in 55 to 77% of 994 responses. A geo experiment therefore treats presence rate, not rank, as the unit of measurement, and it collects enough runs for that rate to settle.
What do the top articles on geo experiments cover, and what do they miss?
Before writing this guide, we looked at pages that rank for the topic. A Search Engine Land article on GEO experiments is a case narrative of tests that challenge conventional AI visibility advice. It is useful for ideas, but it reports tactics rather than a reusable test design. A Fullcast guide on pitching GEO to leadership proposes a control group, three to five test pages and a four to six week review; it does not say how to handle run-to-run noise. A Genixly framework for re-testing LLM visibility covers what to freeze, what to vary and how long to wait, but gives no worked sample-size example and no decision rule.
Peec AI's blog also lists a post on how two teams run their own GEO experiments. This guide covers the same ground and adds three things those pages do not: a sample-size worked example you can reuse, a decision table that turns a result into an action, and a noise budget you set before the test starts.
What is the simplest GEO experiment design?
The simplest design has five parts: a fixed prompt set, a baseline, a single change, a waiting period and a re-measurement against a control. Each part exists to remove one way of fooling yourself.
| Part | What you do | What it protects against |
|---|---|---|
| Prompt set | Choose 15 to 30 prompts and freeze the wording | Moving the goalposts after you see results |
| Baseline | Measure daily for at least a week before changing anything | Mistaking normal variation for an effect |
| Single change | Edit one page or one element | Not knowing which edit caused the result |
| Waiting period | Wait until the change is live and retrievable | Measuring before engines could see the edit |
| Re-measure with control | Run the same prompts, engines and locale; compare with untouched pages | Crediting yourself for market-wide shifts |
The sections below turn this into numbered steps. For prompt selection specifically, see our guide to which prompts to track for AI search visibility.
How do I run a GEO experiment? Seven steps
1. Write the hypothesis and the decision rule first
Action: write one sentence in the form "If we change X on page Y, the presence rate for prompt group Z will rise by at least N percentage points on the engines that use live retrieval." Add the decision rule: what result means ship, iterate or stop. Result: you cannot reinterpret the outcome after the fact. Why: the biggest source of false positives in any experiment is choosing the success measure after seeing the data.
Keep the hypothesis narrow. "Adding a pricing table to the product page will increase how often we are named in answers to 'how much does X cost' prompts" is testable. "Improving content quality will increase AI visibility" is not.
2. Pick the prompts and freeze them
Action: build a prompt set from the questions a buyer asks about your category: comparison, best-of, problem and pricing questions. Group them into prompt families, such as "pricing" or "alternatives", and write each prompt out once. Result: a fixed list you reuse for every measurement. Why: SparkToro found that when 142 people wrote their own prompts for the same headphone need, almost no two looked alike, with a semantic similarity score of 0.081 (Search Engine Journal, January 2026). Real users phrase things differently, so use several phrasings per intent, but do not change them mid-test.
Split the set in two: prompts that your test page should influence (the test group) and prompts about topics where you changed nothing (the control group). The control group tells you whether the whole market moved.
3. Choose the engines and freeze the conditions
Action: list the engines, locale and any account or logged-in state you will use, and keep them identical in every run. Result: differences between measurements come from the answers, not from your setup. Why: engines differ in how they retrieve sources. Ahrefs data reported by Search Engine Journal, January 2026 showed Google's AI Mode and AI Overviews cite different sources 87% of the time for the same query, so even two features from one company should be tracked separately.
Measure across as many engines as you can, then report each one separately and also pooled. A change that helps on Perplexity but not on Claude is a real finding, and pooling hides it. Our comparison of Perplexity, ChatGPT and Gemini for brand visibility explains why engines behave differently.
4. Set the baseline
Action: run the full prompt set on every engine, daily, for at least seven days before touching the page. Record presence (was the brand named), citation (was your URL linked) and, if you care, sentiment. Result: an average and a visible day-to-day spread for each prompt family. Why: that spread is your noise budget. If your presence rate swings between 20% and 40% day to day with no change, a rise from 30% to 38% is not a result.
A baseline also catches traps. If a prompt already returns your brand 95% of the time, it has no room to improve, and if it returns your brand 0% of the time across all engines, the problem is probably eligibility rather than wording. For the second case, read why your brand isn't showing up in ChatGPT answers.
5. Change one page, and record exactly what changed
Action: make one edit to one page, or one class of edit to a small group of similar pages. Save the before and after versions with the date and time. Result: a clear cause to attribute the result to. Why: if you rewrite the intro, add a table and add schema in one release, a win teaches you nothing about which edit mattered.
Good single changes include adding a direct answer in the first 50 words, adding a comparison table, adding sourced statistics, or clarifying the brand description. Princeton's research, published at KDD 2024, reported that GEO methods can boost visibility by up to 40% in generative engine responses, with citations, quotations and statistics among the methods that helped (Princeton University, KDD 2024). Treat that as a source of hypotheses to test on your own category, not a promise. Our guide to sentence structure that gets cited in AI answers lists edits worth trying.
6. Wait for the change to be retrievable
Action: confirm the page is live, crawlable and indexed, then wait. Result: a measurement window that starts when engines could plausibly see the edit. Why: there is no universal delay. Genixly's framework suggests at least several days for on-site updates and one to several weeks for external citations, and Fullcast's pilot template reviews results after four to six weeks. Both are practitioner guidance rather than measured constants, so keep measuring daily through the wait and decide the window in advance.
Do not stop measuring during the wait. A daily series lets you see when the movement begins, which is far more informative than one reading at the end. If the movement starts before the page was live, it was not your change.
7. Re-measure, compare with the control and apply the decision rule
Action: run the identical prompt set on the identical engines for at least as many days as the baseline. Compare the test group's change with the control group's change. Result: a difference-in-differences you can defend. Why: if both groups rose by the same amount, the market moved; if only the test group rose beyond your noise budget, the change likely helped.
Then apply the rule you wrote in step 1. The decision table later in this guide shows what to do with each outcome.
How big does the sample need to be? A worked planning example
The example below is planning arithmetic with hypothetical inputs, not a reported result. Its purpose is to show how quickly observations accumulate and why single checks are too thin.
Suppose you track 20 prompts on 13 engines, once a day, for 7 baseline days. That is 20 x 13 x 7 = 1,820 observations, or 140 per engine and 91 per prompt across all engines. Now suppose you run the test group of 10 prompts for 14 days after the change: 10 x 13 x 14 = 1,820 observations again. Each prompt-engine pair has 7 baseline readings and 14 post-change readings.
Compare that with the common shortcut: one person asks 10 prompts once on 1 engine, before and after. That is 10 observations on each side, and SparkToro's finding that nearly every response differs means those 10 are a thin sample. The first design can detect a moderate shift; the second cannot tell a shift from chance.
| Design | Prompts | Engines | Days | Observations (before + after) |
|---|---|---|---|---|
| Screenshot check | 10 | 1 | 1 + 1 | 20 |
| Minimum credible test | 20 | 13 | 7 + 14 | 5,460 (20 x 13 x 21) |
| Narrow test group only | 10 | 13 | 7 + 14 | 2,730 (10 x 13 x 21) |
Doing 5,460 observations by hand is impractical, which is the real reason most teams fall back on screenshots. Automated repeated measurement is what makes the design feasible.
How do I deal with noisy AI answers?
You cannot remove the noise, so you budget for it. There are five practical controls, and each one is cheap once your tracking is automated.
- Repeat, do not sample once. Take many runs per prompt per day and average them. Presence rate over many runs is more stable than any single answer.
- Use presence rate, not position. SparkToro's co-founder argued that rank position in AI answers is not a meaningful metric; frequency of appearance is the steadier signal.
- Measure the spread in the baseline. The day-to-day range before the change is your noise budget. Only count effects larger than it.
- Use a control group. Prompts and pages you did not touch show you platform-wide drift, such as a model update.
- Hold conditions fixed. Same locale, same engines, same wording, same time of day where possible. If you sell in several markets, repeat the test per locale rather than mixing them.
Keep in mind a caveat from the SparkToro report: the research was done with Gumshoe.ai, which sells AI tracking tools, and the authors disclosed this and published their method and raw data. Read it as strong evidence about variability, not as proof about any one engine's future behaviour.

How can I tell if a content change improved my AI search visibility?
You can tell when the test group's presence rate rose by more than the baseline spread, the control group did not rise by a similar amount, and the rise began after the page was live. If all three hold, treat the change as a probable win; if only one or two hold, keep measuring.
Use this decision table to turn a result into an action. Set the thresholds before you start; replace any placeholder with your own baseline spread.
| Test group change | Control group change | Timing | Reading | Action |
|---|---|---|---|---|
| Up, beyond baseline spread | Flat | After page went live | Probable win | Roll the change to similar pages; plan a second test to confirm |
| Up, beyond baseline spread | Up by a similar amount | Any | Market-wide shift | No credit to the change; check for an engine or model update |
| Up | Flat | Before page went live | Something else caused it | Look for PR, links or other changes in your log |
| Up, within baseline spread | Flat | After page went live | Inconclusive | Extend the measurement window |
| Flat | Flat | After page went live | No detectable effect | Try a stronger change or fix eligibility issues |
| Down | Flat | After page went live | Possible harm | Check the edit; roll back if it persists |
Be especially careful with the second and third rows. They are the most common reason teams claim a win that was not theirs.
Which metrics should a geo experiment track?
Track three layers: mention, citation and downstream behaviour. Mention presence is the share of runs in which your brand is named. Citation presence is the share in which your URL appears as a source. Downstream behaviour is referral traffic or conversions from AI engines, which moves slowly and is affected by many things, so treat it as supporting evidence only.
| Metric | How to calculate | Best for | Weakness |
|---|---|---|---|
| Mention rate | Runs naming the brand divided by total runs | Brand-level change | Counts mentions that may be negative |
| Citation rate | Runs linking your URL divided by total runs | Page-level change | Not every engine shows sources |
| Share of voice | Your mentions divided by all brand mentions in the set | Competitive position | Depends on which competitors you list |
| Sentiment or framing | Share of mentions that are positive or neutral | Positioning and messaging tests | Needs a consistent coding rule |
| AI referral sessions | Analytics sessions from AI engines | Business impact | Slow, partly invisible, many confounders |
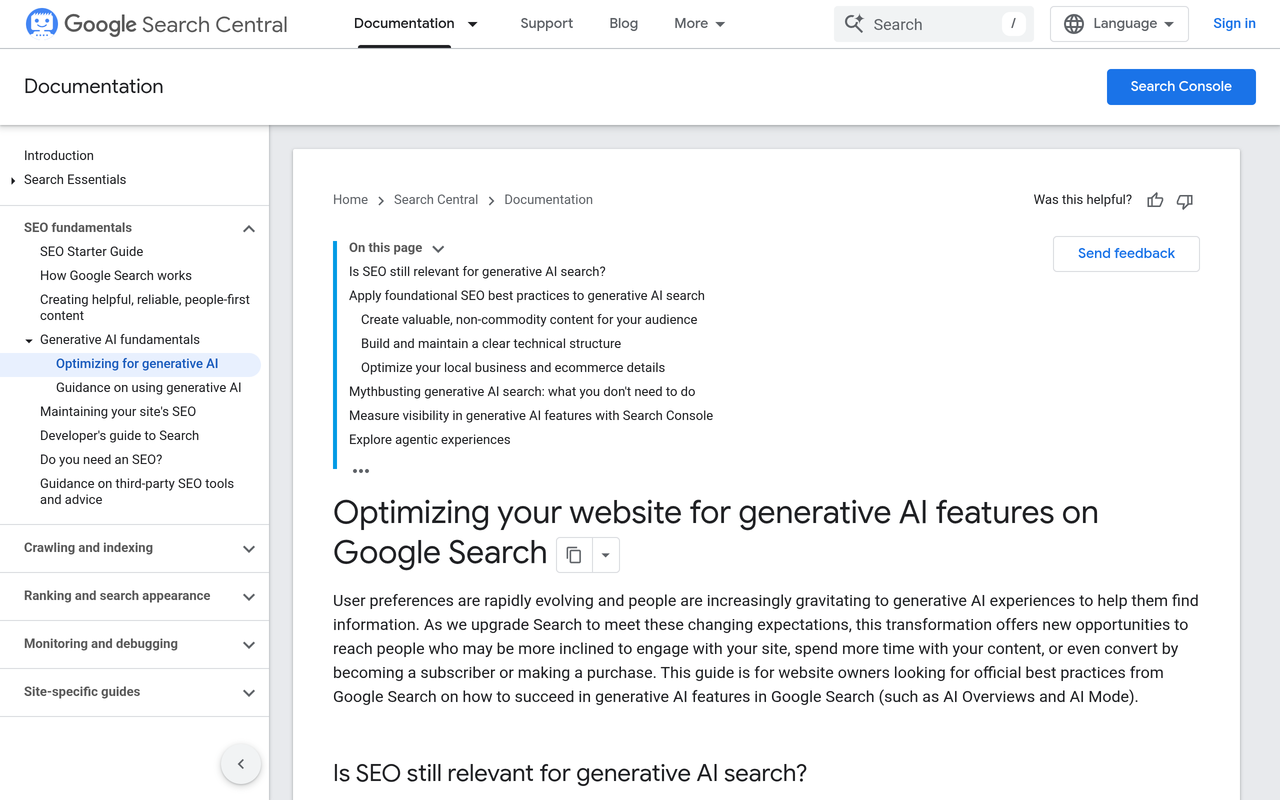
Our guide to how to measure AI search share of voice covers the third metric in more depth. For Google specifically, Google announced Search Generative AI performance reports in Search Console (Google Search Central Blog, June 2026), which gives you first-party data to cross-check your own tracking. Google's own guide to optimizing for generative AI features describes what it says site owners should do to appear in AI Overviews and AI Mode.
What should I change first? Test candidates ranked by effort
Pick changes you can make in under a day, so you can run several tests in sequence rather than one large one. The table lists candidates and the prompt family each should influence.
| Change to test | Effort | Prompt family to watch | Related guide |
|---|---|---|---|
| Add a 40 to 60 word direct answer at the top | Low | Definition and how-to prompts | Writing content AI engines quote |
| Rewrite the brand description for clarity | Low | Category and "what is" prompts | Brand description for AI search |
| Add or rewrite an FAQ section | Low | Question-style prompts | FAQ page for AI search |
| Add a comparison table | Medium | Alternatives and versus prompts | Checking your site for AI answers |
| Add schema markup | Medium | Product and shopping prompts | Schema markup for AI search |
| Publish original data | High | Statistic and research prompts | Publishing original data |
Run them one at a time. If you must run two at once, put them on different pages serving different prompt families, so the results do not overlap.
What are the common mistakes in a geo experiment?
- Declaring victory from one screenshot. With the variability SparkToro documented, one answer is an anecdote.
- Changing the prompt wording mid-test. It breaks comparability between baseline and result.
- Bundling several edits. You cannot say which edit worked, so you cannot repeat it.
- Skipping the control. A model update can lift or lower every brand at once.
- Pooling all engines into one number. It hides engine-specific wins and losses.
- Measuring rank position. The research above suggests frequency is steadier than position.
- Not logging outside events. A press mention or a competitor launch can swamp your edit.
- Stopping too early. Some effects, especially from external citations, take weeks.
A related trap is testing in a category where engines rely mostly on their training data rather than live retrieval. Engines that search the web as they answer should respond faster to page edits than those that do not, so note the retrieval behaviour of each engine when you interpret timing. Our piece on why competitors' older content keeps getting recommended explains one reason edits can seem to have no effect.
Checklist: a geo experiment you can copy
- Write the hypothesis and decision rule in one paragraph; save it with the date.
- List 15 to 30 prompts in 3 to 5 families; freeze the wording.
- Assign each prompt to the test group or the control group.
- Choose engines, locale and settings; do not change them mid-test.
- Measure daily for at least 7 days; record mention, citation and spread.
- Check that no other site, PR or product change is planned in the window.
- Make one change to one page; save before and after versions.
- Confirm the page is live, crawlable and indexed; start the clock.
- Keep measuring daily; log outside events as they happen.
- After the planned window, compare test and control against the baseline spread.
- Apply the decision table; record the outcome, even if it is "no effect".
- Pick the next single change and repeat.
How does Noma by Nurdd supply the measurements this test needs?
Noma by Nurdd is a web dashboard that tracks whether a brand appears in answers from 13 AI engines, including ChatGPT, Gemini, Perplexity and Claude, polled daily. It shows citation frequency by category, competitor comparison and recommendations for improving AI visibility, which gives a geo experiment the repeated baseline and post-change series that single checks cannot.
Book a demo at https://www.nurdd.club/demo to see how Noma tracks AI visibility.
Noma has a 3-day free trial. A card is taken at signup and billing starts on day 3; if you cancel before then, you are not charged. You can see the product at nomahq.app. If you would rather have specialists design and run the tests, Nurdd's answer engine optimization agency and generative engine optimization services measure results in Noma. For a quick readiness check before you design a test, try the free GEO readiness scorecard. More tools are on the free tools page.
When you compare tracking tools for this job, check three things: whether it repeats measurements daily, whether it reports by engine, and whether it lets you group prompts into test and control sets. See our comparison of AI search visibility tools and how to track an AI visibility score week over week.
How we researched this
We searched for current coverage of GEO experiments and reviewed the pages ranking for the topic, noting their structure and gaps. We reviewed an academic paper record (Princeton, KDD 2024), Google's own documentation and announcements, and trade press reporting on SparkToro's repeated-run study. We checked each linked source on the publication date of this article. We did not run our own experiments for this guide, so the worked example is planning arithmetic with hypothetical inputs, and the timing guidance reflects published practitioner advice rather than measured constants.
Frequently asked questions
What is a geo experiment?
A geo experiment is a controlled test of whether a specific content change alters how often AI engines mention or cite your brand. It uses a fixed prompt set, a baseline, one change and a re-measurement against a control. The aim is to separate a real effect from the natural variation in AI answers.
How long should a GEO experiment run?
Run at least a week of baseline, then a post-change window of two to six weeks. Genixly suggests several days for on-site edits and one to several weeks for external citations, and Fullcast's pilot template uses four to six weeks. These are practitioner suggestions, so choose your window before starting and keep it fixed.
How many prompts do I need?
Start with 15 to 30 prompts grouped into three to five families, with several phrasings per intent. Fewer than that makes the presence rate swing too much. Split them into a test group and a control group so you can see market-wide drift.
Why do AI answers change every time I ask?
Because AI engines generate answers rather than retrieve a fixed list, and the sources they retrieve vary as well. SparkToro's study found the same brand list came back less than 1% of the time on repeated runs of the same prompt. This is why you average over many runs.
Can I test GEO changes without a tracking tool?
You can, but the volume is hard to sustain. The minimum credible design in the worked example above needs thousands of observations, which is unrealistic by hand. A manual test is fine for spotting problems, not for proving an effect.
Should I test every engine or just ChatGPT?
Test several and report each separately. Ahrefs data reported by Search Engine Journal shows even Google's AI Mode and AI Overviews cite different sources most of the time, so engines cannot be assumed to behave alike. A change can help on one engine and do nothing on another.
Is rank position in AI answers worth tracking?
It is a weak metric. SparkToro found that the same list in the same order appeared less than 0.1% of the time, and its co-founder argued that frequency of appearance is the steadier signal. Use presence rate and citation rate as primary measures.
What if my result is inconclusive?
Extend the measurement window, check whether the baseline spread was larger than expected, and verify that the page was indexed. If it is still flat, try a larger single change or look at eligibility issues such as crawl access or unclear brand description. Record the outcome either way, because a null result is still information.
Run your first geo experiment with daily measurement across 13 engines
A geo experiment only works when you can measure the same prompts on many engines, every day. Book a demo at https://www.nurdd.club/demo to see how Noma tracks AI visibility, then choose the first page to test.