
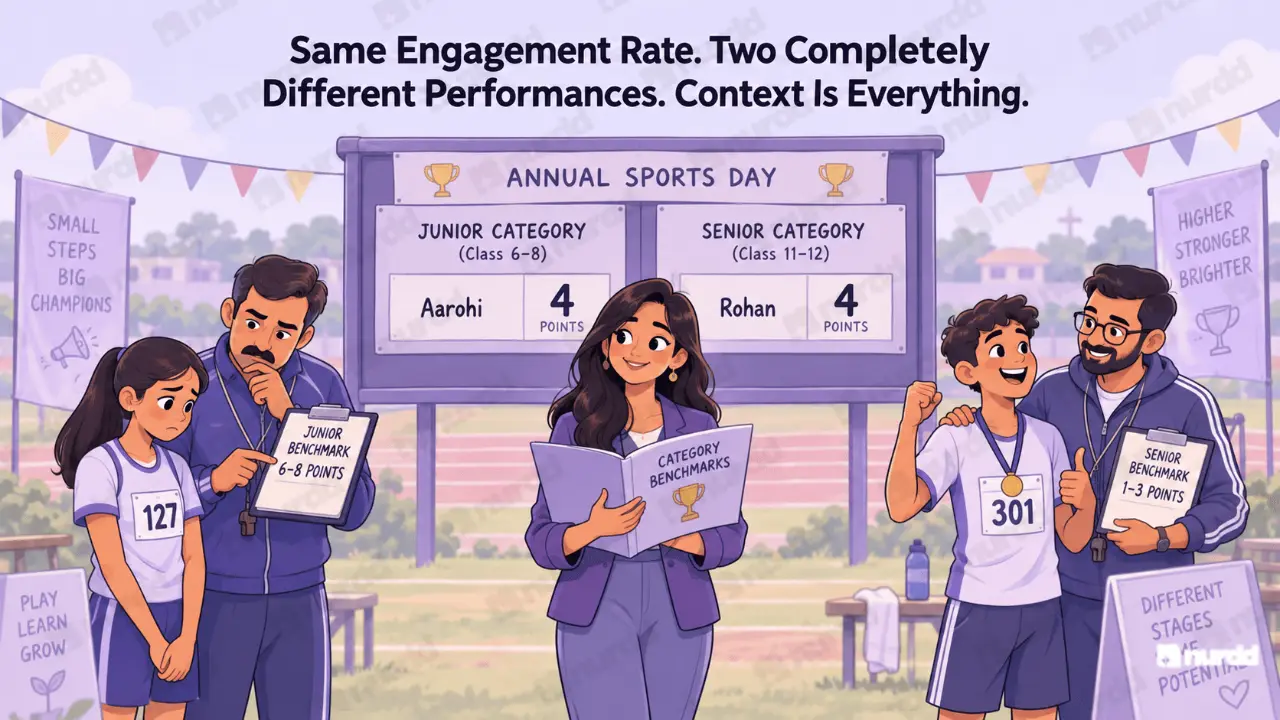
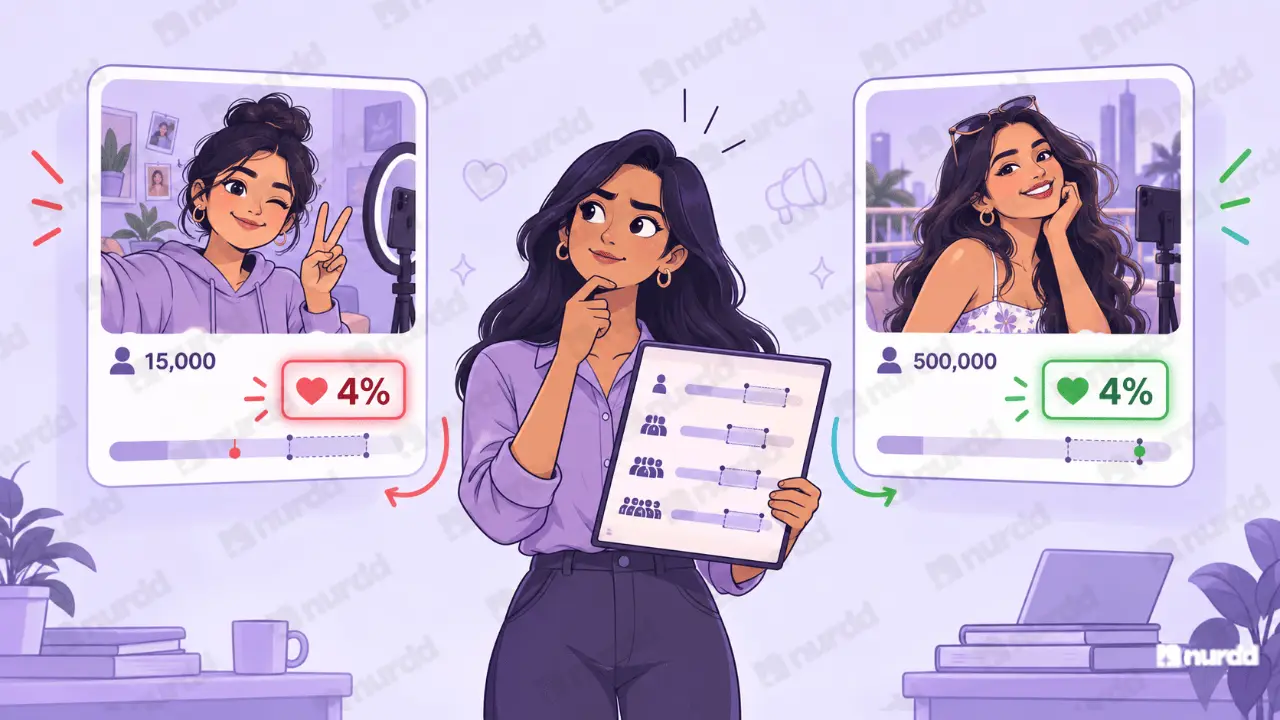
A 4% engagement rate means something completely different for a 500,000-follower Instagram creator than for a 15,000-follower niche food blogger. And Instagram's engagement rate means something completely different from YouTube's. Here are the platform-specific benchmarks that give you a real frame of reference.
Instagram Benchmarks
Instagram Engagement Rate by Tier — 2026
Tier | Followers | Organic Posts | Reels | Paid Brand Posts | Concern Signal |
|---|---|---|---|---|---|
Nano | 5K – 30K | 5.8 – 9.2% | 6.1 – 11.4% | 3.5 – 6.8% | Below 3% on paid |
Micro | 30K – 200K | 2.4 – 5.1% | 3.2 – 6.8% | 1.6 – 3.4% | Below 1.5% on paid |
Macro | 200K – 1M | 1.0 – 2.2% | 1.4 – 3.1% | 0.7 – 1.5% | Focus on absolute volume |
For macro creators, absolute engagement volume matters more than rate. A 0.9% rate on 600,000 followers is 5,400 engaged users which can drive meaningful sales volume even below benchmark rate.
Story completion rate is a more valuable metric than feed engagement for conversion campaigns. A story where 65% of viewers complete all 5 frames indicates high intent. Below 40% completion by frame 3 means your message is not holding attention.
YouTube Benchmarks
YouTube Engagement — Calculated Differently
YouTube engagement rate is (likes + comments + shares) ÷ views not ÷ subscribers. This makes YouTube engagement rates structurally lower than Instagram rates. Do not compare the two directly.
Micro YouTube creators (30K to 200K subscribers): average engagement rate 2.1 to 4.8% per video
Click-through to external link in description: 0.3 to 1.1% of views
Sponsored integration click-through rate: typically 0.4 to 0.8% of total video views
For YouTube influencer campaigns, view-through rate to 30 seconds is the more useful performance signal than overall engagement rate. A creator whose viewers watch 30 seconds of their product integrations consistently is building purchase intent that may convert days after viewing not captured by click-through alone.
LinkedIn Benchmarks
LinkedIn — Higher Than Global Averages
LinkedIn engagement rates in India are higher than global averages due to lower overall post volume and higher professional intent per session.
D2C founder / B2B adjacent creators: 2.8 to 6.4% engagement rate per post
Comment-to-like ratio matters more here than total engagement posts with specific reactions to the brand generate stronger conversion signals than posts with many likes and few comments
When a Creator Is Below Benchmark
Ask These Three Questions First
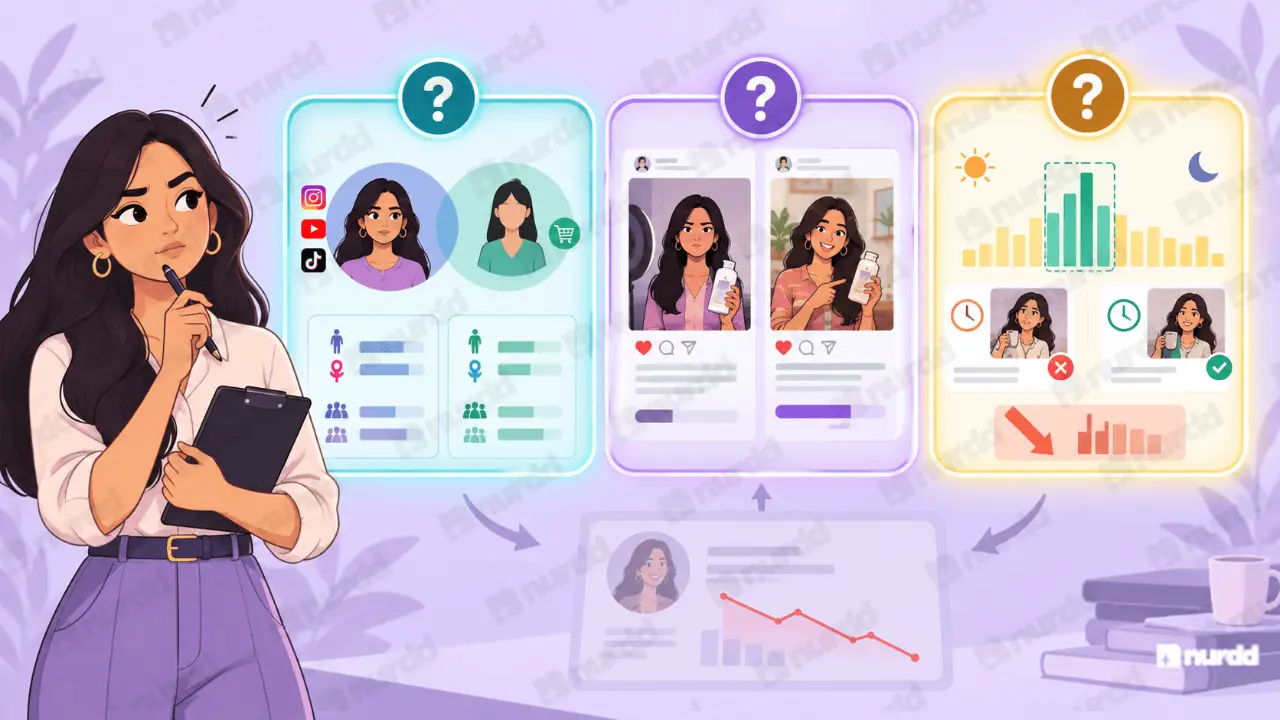
A below-benchmark engagement rate is a question, not a verdict. Before removing a creator from your programme, investigate which of these three variables is the cause:
Audience mismatch the creator's audience does not align with your product category or buyer profile
Creative brief too restrictive content that reads as an ad rather than a genuine recommendation consistently underperforms organic
Posting timing wrong posting outside the creator's peak audience active hours can suppress engagement by 30 to 50%
Fake Engagement — How to Detect It
The Signals That Separate Real from Bought
Fake engagement is a persistent problem in the Indian creator market, particularly in the 30,000 to 150,000 follower range where accounts can purchase engagement cheaply enough to maintain plausible deniability.
Engagement pattern red flags:
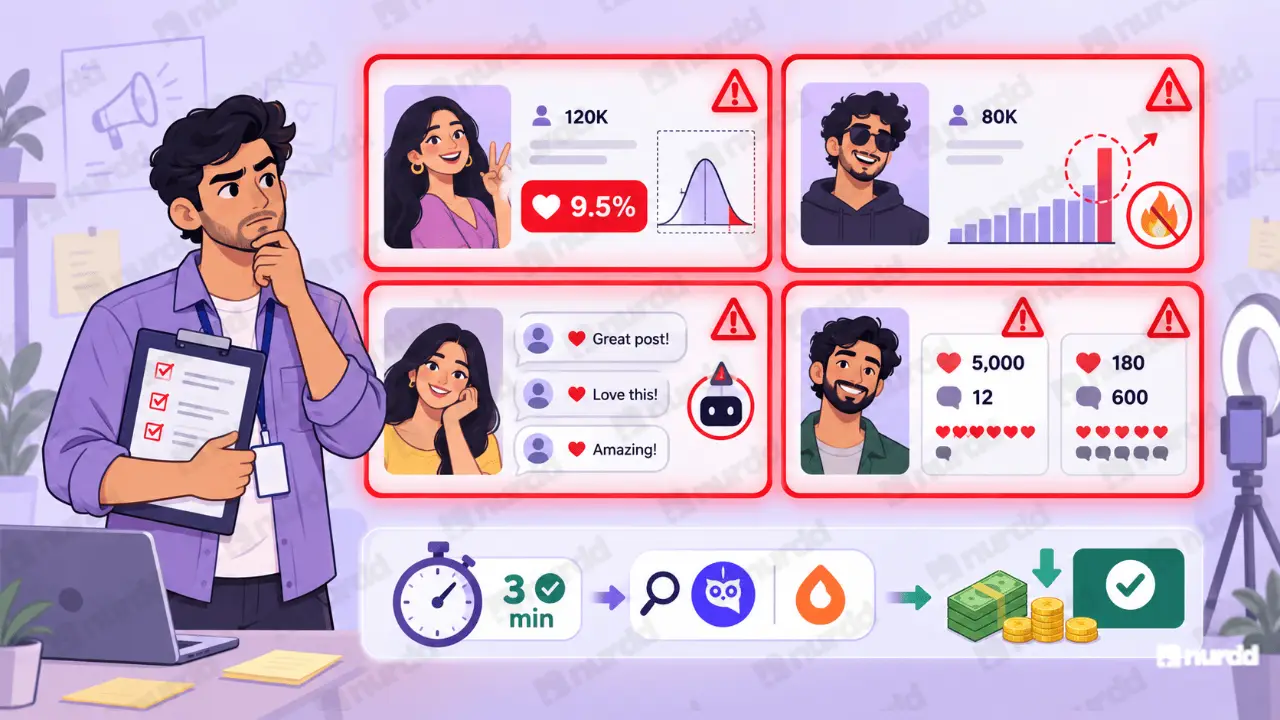
Engagement rate above 8% on accounts above 50,000 followers statistically very rare without artificial inflation
Follower count grew by more than 20% in any single month without a corresponding viral moment or media feature
Comments are generic and interchangeable "Great post!", "Love this!", "Amazing!" with no content-specific responses
Like-to-comment ratio is extreme 5,000 likes and 12 comments, or 180 likes and 600 comments
Tools like Qoruz, HypeAuditor, and Modash provide automated fake follower detection scores for Indian creators. Before committing to a creator at Rs 30,000 or above, run a quick detection check. Most platforms offer a free report for individual creator analysis. It takes 3 minutes and can save Rs 30,000 on a campaign that was never going to convert.
"An engagement rate below benchmark is a question, not an answer. Ask whether the audience, the content, or the product fit is the variable before making a decision about the creator."
Sources and References
Socialinsider – Instagram Engagement Rate Benchmarks Study
Qoruz – India influencer engagement analytics platform
HubSpot – Social media benchmarks by platform
Nurdd / Nia – Platform engagement rate benchmark resources for Indian D2C brands

Find the right creators — and verify they're real.
Nia gives brands access to 10M+ Indian creator profiles, TruAI fake follower detection, pre-spend ROI forecasting, and product-level sales attribution. Completely free.