Influencer Marketing
Influencer vs Performance Marketing: Compare True CAC
Compare influencer and performance marketing on one CAC formula, with a decision table, a worked incrementality example and a checklist for D2C brands.
 Simran Rawat26 Sept 202615 min read

Neither channel is cheaper by default. Performance marketing usually wins on capturing demand that already exists, and influencer marketing usually wins when a product needs demonstration or trust. The only fair comparison is blended and incremental CAC, with the same new-customer definition and the same cost scope on both sides.
Influencer vs performance marketing is a question about cost per new customer, and the answer depends on how each channel's CAC is calculated. Performance ads tend to win where demand already exists, while creators tend to win where a product needs demonstration or trust. Compare both on blended and incremental CAC before moving budget.
Key takeaways
- Use one CAC definition for both channels: all costs, divided by verified new customers, in the same time window.
- Platform-reported conversions overstate results. A geo-holdout or conversion lift test gives you an incrementality factor to correct each channel's CAC.
- Creators fit products that need showing or explaining. Paid search and retargeting fit demand that already exists.
- Cost per creator deliverable varies by more than 20x across tiers, so compare cost per view and cost per new customer, not the invoice.
- Run the two channels as a loop: creator content becomes ad creative, and ad data sharpens the next creator brief.
- Decide on blended CAC against your own margin and repeat-purchase rate, not on a single ROAS screenshot.
Why is influencer vs performance marketing so hard to compare?
The two channels report success in different units. Meta and Google Ads report conversions and ROAS inside their own attribution windows, while influencer campaigns often report views, engagement and promo-code redemptions. Putting a CPM next to an engagement rate tells you nothing about which channel produced the cheaper customer.
There is also a structural problem. Performance channels sit close to the purchase, so they collect credit for buyers who were persuaded earlier by a creator, a friend or a search result. Influencer activity sits earlier, so a lot of its effect arrives as branded search, direct visits and later retargeting clicks. Each channel's own dashboard is therefore biased, in opposite directions.
The market is already moving toward one standard. impact.com, 2026 reports that 74 percent of brands are moving budget into creator programs in 2026, and frames creator work as something judged on CAC, AOV and ROI, the same standards as paid media. If creators are judged like paid media, they need to be costed like paid media.
What is the difference between influencer marketing and performance marketing?
Performance marketing buys measurable actions, usually clicks and purchases, through ad auctions on Meta, Google and similar platforms. Influencer marketing buys a creator's attention and credibility, and pays a fee, a commission or product, usually before the purchase decision forms. In practice the lines blur: a creator on a commission deal is a performance channel, and a paid ad using creator footage is an influencer asset.
| Dimension | Performance marketing (paid ads) | Influencer marketing |
|---|---|---|
| Main job | Capture and convert existing demand | Create demand and trust, then convert some of it |
| Cost model | Auction: CPM, CPC, CPA | Fee per deliverable, commission, or product |
| Attribution | Platform-reported, click and view windows | Links, codes, surveys, platform data, often incomplete |
| Speed | Days to launch, stops when spend stops | Weeks to brief and publish, content can keep working |
| Reusable asset | Ad creative you own | Creator content, with usage rights you negotiate |
| Main risk | Rising auction costs, inflated reporting | Fake followers, weak fit, untracked sales |
How do you calculate CAC for each channel on the same basis?
Customer acquisition cost is total acquisition cost divided by net new customers in the period. eightx, 2026 defines it as including ad spend, marketing salaries, tools and agency fees, and recommends tracking both blended CAC (all channels) and channel-specific CAC. The same cost scope has to apply to creators and ads or the comparison is rigged.
For performance marketing, include ad spend, agency or freelancer fees, creative production and the tools you pay for to run it. For influencer marketing, include creator fees, product and shipping cost, agency or platform fees, usage-rights fees, and the time spent briefing and managing. The most common error is to count only the creator fee.
| Metric | Formula | What it tells you |
|---|---|---|
| Channel CAC | Fully loaded channel cost ÷ verified new customers from that channel | Efficiency of one channel, if attribution is honest |
| Blended CAC | Total acquisition spend ÷ total new customers | The number the business actually pays |
| MER | Total revenue ÷ total marketing spend | Business-level efficiency that ignores platform attribution |
| Incremental CAC | Channel cost ÷ incremental new customers from a test | What the channel adds beyond what would have happened anyway |
eightx, 2026 describes platform-reported ROAS as inflated since iOS14, calls MER the truest business-level picture, and says blended CAC is the metric that drives scaling decisions, with a target LTV:CAC of 3:1 or better. Those are that publisher's guidance rather than universal rules, but the logic holds: read ROAS, MER and CAC together.
What do the published benchmarks say about paid CAC inputs?
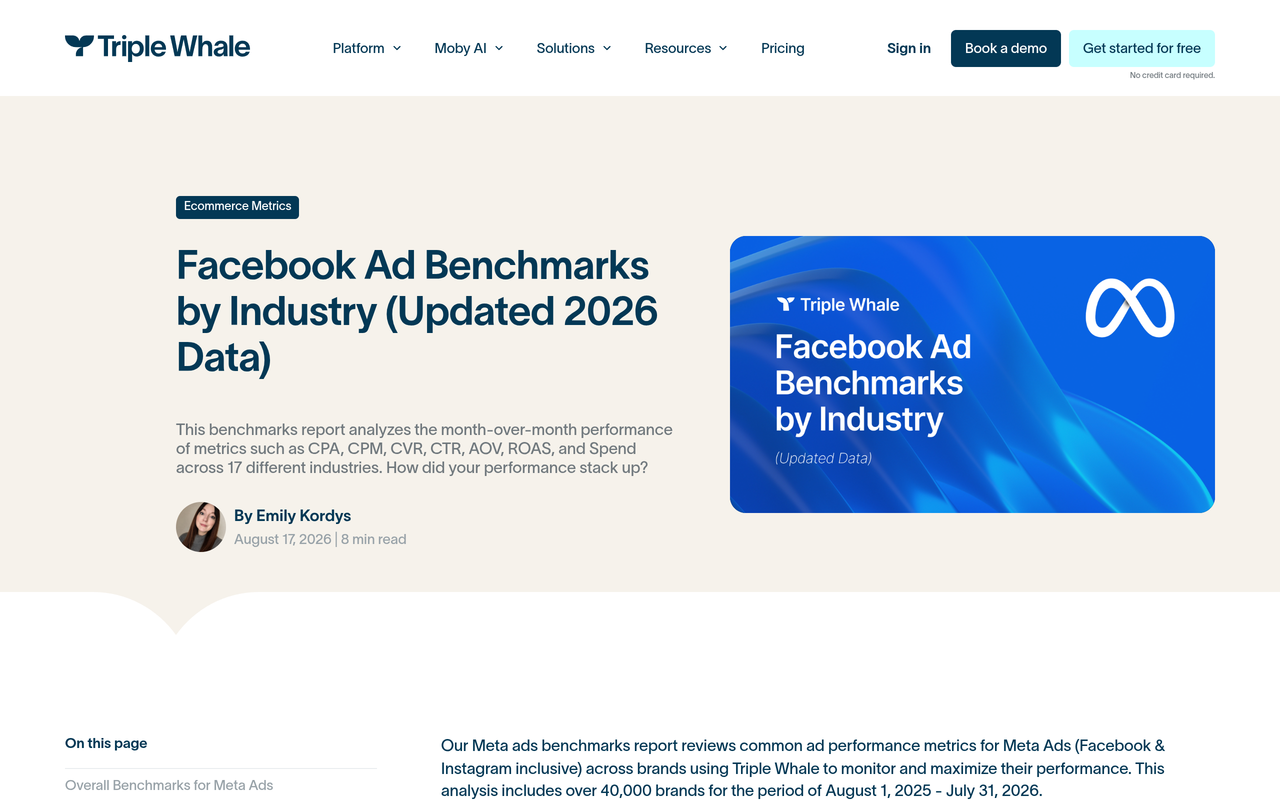
Paid-side benchmarks give you a sanity check, not a target. The Nurdd marketing benchmarks hub lists Triple Whale medians for August 2025 to July 2026, drawn from more than 40,000 ad accounts: a Meta CPM of $15.06 and ROAS of 1.88, against a Google Ads CPM of $15.35 and ROAS of 3.27.
The Google Ads median ROAS is higher than Meta's. Intent-driven search is a plausible reason, since people are already looking, but that is an inference rather than something the benchmark data itself states, and the figures cover Google Ads as a whole, not Search alone. For category detail, see Nurdd's paid media benchmarks by category.
Here is arithmetic, not a data point. If a brand's gross margin were 50% (an assumption), break-even ROAS on a first order would be 2.0, because $1 of revenue returns $0.50 of margin. A median Meta ROAS of 1.88 sits just under that line, which is why first-order CAC alone can mislead and why repeat purchases belong in the calculation. You can test your own margin in the Google + Meta ROAS calculator.
What do creators actually cost, and why does the invoice mislead?
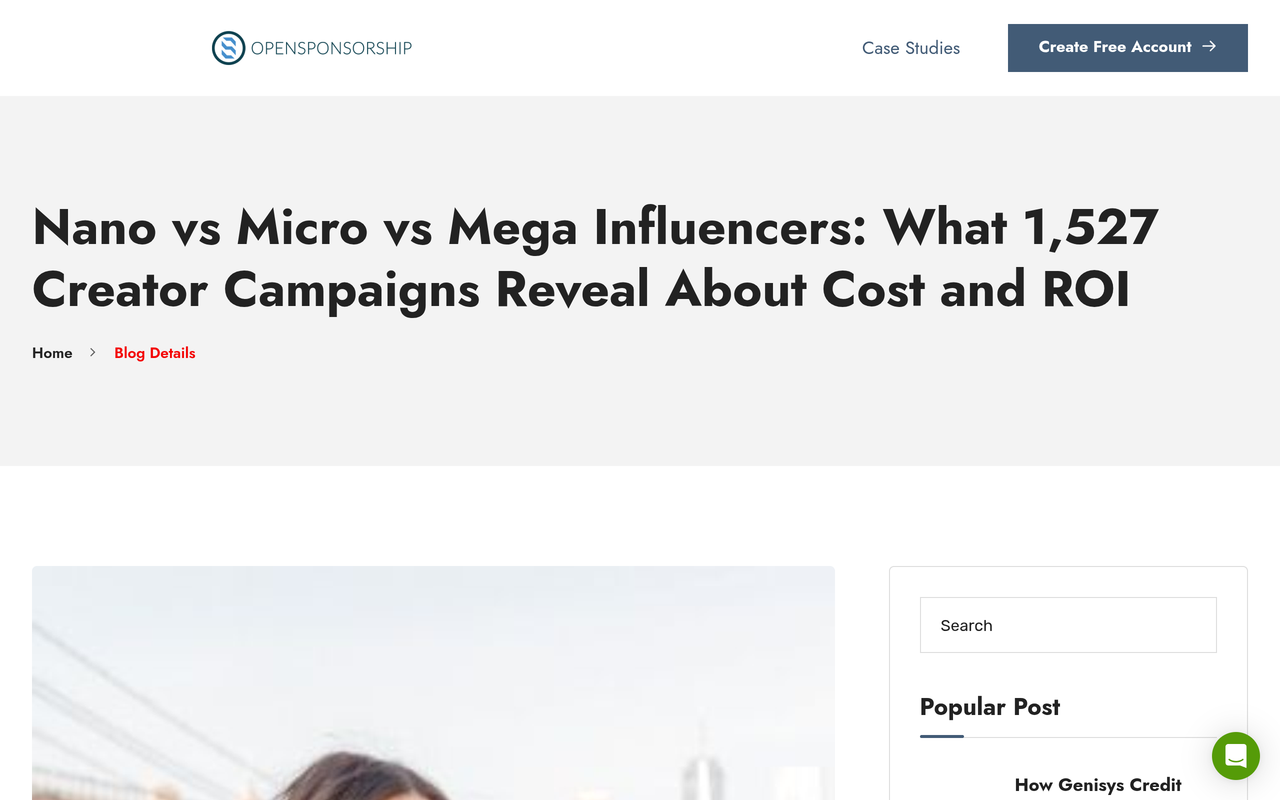
Creator fees vary enormously by tier, and the cheapest invoice is not the cheapest customer. OpenSponsorship, 2026 reports a median of $134 per deliverable for nano creators and a median of $2,727 for mega creators, roughly a 20x gap in price. The same analysis finds nano creators generate 20x more views per follower than mega creators, yet they do not win on cost per view.
That analysis also flags the 50K to 250K follower tier as the worst on both cost per view and cost per engagement among the tiers measured. For a D2C buyer, the lesson is to price by outcome. A cheap nano post with no purchase path can have a worse CAC than one pricier mid-tier video with a code, a link and usage rights. The influencer rate card estimator and Nurdd's influencer pricing benchmarks by tier help you sanity-check quotes.
How to compare influencer and performance marketing CAC in 7 steps
Follow these steps in order. Each one ends in something you can write down and check.
1. Fix the definition of a new customer
Action: Define a new customer as someone with no previous order in your store, verified in your commerce platform, not in an ad dashboard. Result: one customer list that both channels are measured against. Why: platforms count repeat buyers as conversions, which flatters retargeting and makes both channels look cheaper than they are.
2. Load every cost into each channel
Action: For ads, add spend, fees, creative production and tools. For creators, add fees, product and shipping, platform or agency fees, usage rights and management time. Result: a fully loaded cost per channel for the same dates. Why: a creator CAC that leaves out product cost and rights will look better than it is, and an ad CAC that leaves out creative production will too.
3. Capture every creator conversion path
Action: Give each creator a unique tracking link and a unique code, and add a post-purchase question asking where the buyer heard of you. See Nurdd's UTM structure guide for influencer campaigns. Result: link, code and self-reported sales in one sheet. Why: link-only tracking misses code-only buyers and people who search your brand name after seeing a post.
4. Calculate channel CAC and blended CAC side by side
Action: Divide each channel's loaded cost by its verified new customers, then divide total spend by total new customers. Result: three numbers per period. Why: channel CAC shows where attribution claims credit, while blended CAC shows what you really pay, and a gap between them is the first sign of double counting.
5. Correct each channel with an incrementality test
Action: Run a geo-holdout or platform conversion lift test on the channel you trust least. Result: an incrementality factor. Why: Haus, 2026 explains that the factor is the ratio of incremental conversions to platform-reported conversions, so reported CAC can be divided by it to get a more honest figure. The worked example below shows the arithmetic.
6. Add repeat purchase and margin
Action: Compare each channel's CAC with first-order gross margin and with 12-month margin per customer. Result: an LTV:CAC ratio per channel. Why: creator-acquired customers and search-acquired customers may reorder at different rates, and a higher CAC can still pay back if the customer returns. Nurdd's guide to ecommerce KPIs that predict profit covers this.
7. Reallocate in small steps and re-measure
Action: Move a fixed slice of budget toward the channel with the better incremental CAC, hold everything else constant for a full buying cycle, and test again. Result: a measured change in blended CAC. Why: big reallocations confuse the signal, and ad platforms also need time to re-learn when budgets shift.
Worked example: how much does an incrementality factor change CAC?
This example uses the figures Haus, 2026 gives in its own explanation of the incrementality factor. Meta reported 500 conversions, and the holdout test showed 300 incremental conversions, so the incrementality factor is 0.6. Only 60% of the reported conversions were truly incremental.
| Step | Calculation | Result |
|---|---|---|
| Reported conversions | From the ad platform | 500 |
| Incremental conversions | From the holdout test | 300 |
| Incrementality factor | 300 ÷ 500 | 0.6 |
| Reported CAC for spend S | S ÷ 500 | S/500 per customer |
| Incremental CAC for the same spend | S ÷ 300 | S/300 per customer |
| Difference | (S/300) ÷ (S/500) | About 1.67x higher than reported |
Whatever the spend S, true acquisition cost was about two thirds higher than the dashboard said. Now apply the same logic to a creator campaign: if a creator's tracked link and code show a set number of sales but a post-purchase survey shows more buyers who credit the creator, the creator channel is under-reported, not over-reported. Correcting both sides, in opposite directions, is the point of the exercise.
Test design matters. According to Haus, 2026, Meta's Conversion Lift needs a minimum seven-day test and at least 10% of the audience in each test cell, while geo-holdouts need enough regions and volume to detect a difference. Nurdd's GEO experiment design guide is about AI visibility, but the holdout logic is similar; for influencer-specific methods see how to calculate influencer campaign incrementality.
When does influencer marketing give a lower CAC than paid ads?
Influencer marketing tends to lower CAC when the work of persuasion is the expensive part. Three conditions make that most likely, and each is a hypothesis you can check against your own data rather than a guarantee.
- The product needs showing or explaining. Skincare routines, supplements, fashion fit and food taste are easier to sell in a demonstration than in a static ad.
- The auction is crowded. In categories with heavy ad saturation you pay more for every impression, and creator content can win attention that a brand-shot ad does not.
- You are entering a new audience. A creator already trusted by a community gives you an introduction that cold targeting cannot copy.
These conditions show up often in beauty, fashion, food and fitness. Nurdd's industry pages for beauty, fashion and apparel and food and beverage set out how those categories use creators.
When does performance marketing give a lower CAC than influencers?
Performance marketing tends to win when the customer has already decided and only needs to be found. Searching for a specific product, returning to a basket, or responding to a clear price offer are all moments where creator fees add cost without adding persuasion.
- Demand exists. Search captures active intent. The Google Ads median ROAS of 3.27 against Meta's 1.88 in the Triple Whale data on the Nurdd benchmarks hub is consistent with that, though the data does not state the cause.
- The audience is warm. Retargeting people who already know your brand is usually cheaper than building that audience through creators.
- The offer is price-led. A discount or bundle is communicated precisely in an ad format, while creator content mostly communicates trust.
Be careful with retargeting, though. It can claim sales that would have happened anyway, which is exactly what an incrementality test exposes. Nurdd's guides on retargeting waste and inflated Meta ROAS cover the failure modes.
Which channel fits which situation? A decision table
Use this table as a starting hypothesis for where to test first. It is a framework built from the conditions above, not a measured result.
| Your situation | Lean toward | First test to run | Metric to judge it |
|---|---|---|---|
| Product needs demonstration or education | Creators | Three to five creators in one niche, unique codes and links | Incremental CAC and post-purchase survey share |
| High search volume for the product category | Paid search | Non-brand search campaign against a geo holdout | Incremental CAC |
| Strong brand, large past-buyer list | Retargeting and email | Holdout of a share of the warm audience | Incrementality factor |
| Meta costs climbing and creative fatiguing | Creator content used as ad creative | Run creator footage as paid ads against brand-shot ads | Cost per new customer, hook rate |
| Entering a new audience segment | Creators first, paid second | Seed creators, then retarget engagers | Blended CAC over a full buying cycle |
| Price-led offer with tight margin | Paid search and Meta conversion ads | Offer-led ad variants | First-order CAC against break-even ROAS |
How should you split budget between creators and ads?
There is no verified universal split, and sources that publish fixed percentages are giving opinion, not evidence. A better approach is a staged rule. Start with the share you can afford to lose over one buying cycle, measure incremental CAC for each channel, then shift budget in steps toward whichever channel is cheaper at the margin.
The more useful pattern is a loop rather than a split. Creator content becomes ad creative, ad results show which hooks and creators work, and the next creator brief uses that information. Nurdd's influencer marketing flywheel post covers the retention side of this loop, and the marketing budget planner lets you split a budget across creators, Meta and Google and see the result.
A fair comparison needs three things on both sides: the same definition of a new customer, the same cost scope, and an incrementality correction. Without those, a channel's CAC is a statement about its dashboard, not about your business.
Checklist: audit your influencer vs performance CAC this month
- Export new customers from your commerce platform for the last 90 days, excluding repeat buyers.
- List all paid costs: ad spend, fees, creative production and tools.
- List all creator costs: fees, product, shipping, usage rights, platform or agency fees and management time.
- Check that every creator has a unique link and code, and add a where-did-you-hear-about-us question at checkout.
- Calculate channel CAC for Meta, Google and creators, then blended CAC for the whole period.
- Compare blended CAC with the sum of channel-reported customers. If the sum is far higher than your real new-customer count, attribution is double counting.
- Pick the channel you trust least and design a holdout or lift test.
- Compute each channel's incrementality factor and divide reported CAC by it.
- Check creator audiences for fake followers before the next payment, using the fake follower checker and the fake follower audit checklist.
- Compare 12-month margin per customer to CAC for each channel, then move a small slice of budget and re-measure.
What are the common mistakes when comparing the two channels?
- Counting estimated media value as revenue. Media value is not a sale. Use verified orders.
- Counting only the creator fee. Product, shipping, rights and management time belong in the cost.
- Trusting last-click for creators. Creator influence often lands as branded search or direct traffic. See last-touch vs multi-touch attribution for influencer campaigns and dark social attribution.
- Trusting platform ROAS for ads. Reported conversions include sales that would have happened anyway.
- Paying by follower count. OpenSponsorship's tier data shows price and efficiency do not move together.
- Judging too early. A creator campaign and an ad test both need a full buying cycle before CAC settles.
- Ignoring audience quality. Fake or inactive followers inflate reach and wreck CAC, which is why vetting comes before payment.
How does Nia by Nurdd help measure influencer CAC?
Nia by Nurdd is an AI-native creative studio at getnia.studio with influencer marketing built in. It finds creators from a database of 10M+ profiles, scores each shortlisted creator for fake followers with TruAI before a rate is agreed, forecasts ROI before you brief anyone, and attributes product-level sales to specific creators after the campaign closes. It also makes product and UGC ads from a link, so creator content can be turned into ad creative. Nia is priced below comparable plans.
Ready to see it? Book a demo of Nia by Nurdd.
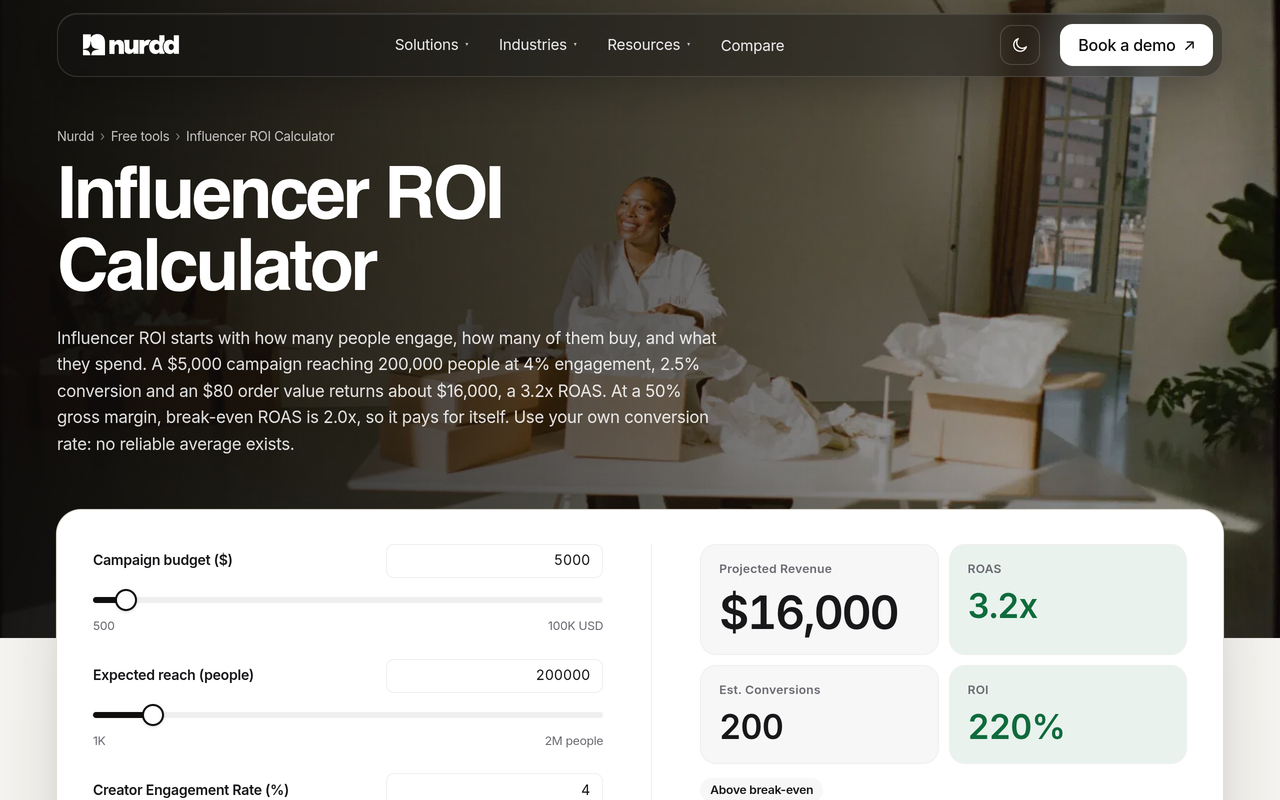
If you want to test the maths first, the influencer ROI calculator projects revenue and ROAS from a creator budget, and the Nia overview explains the full workflow. Nurdd's guides on influencer performance attribution and picking influencers by predicted sales go deeper.
What should a D2C team do next?
Start with the audit, not the budget. Calculate blended CAC, check it against the channel numbers, and run one incrementality test on the channel whose reporting you trust least. Then use the decision table to pick the first creator test, and re-measure after one full buying cycle.
Treat influencer vs performance marketing as a measurement problem before it is a budget problem. Once both channels are costed the same way, the right split becomes visible in your own numbers. Book a demo of Nia by Nurdd to see how it handles creator discovery, fake follower scoring, ROI forecasting and creator-level attribution.
How we researched this
We reviewed published articles on influencer and performance marketing, an ad benchmark summary based on Triple Whale data, a creator pricing study, an incrementality testing guide and CAC metric explainers. Numbers appear as those sources state them, and sources were checked on the publication date. We did not run hands-on tests, interview customers or use private data. The worked example uses figures from the cited source plus simple arithmetic, which is labelled as such.
Frequently asked questions
Is influencer marketing cheaper than performance marketing?
It depends on the product and on how you measure. Creators can lower CAC when a product needs demonstration or trust, while paid search usually wins on existing demand. Compare incremental CAC for both, using the same new-customer definition and cost scope.
How do you calculate CAC for influencer marketing?
Add creator fees, product and shipping cost, platform or agency fees, usage rights and management time, then divide by verified new customers attributed to creators. Use unique links, unique codes and a post-purchase survey so code-only and search-later buyers are counted.
What is a good CAC for a D2C brand?
A good CAC is one your margin can pay back. eightx recommends an LTV:CAC of 3:1 or better as a scaling target, and gives a max allowable first-order CAC formula based on order value and gross margin. Your own margin and repeat rate matter more than any average.
Why does my Meta ROAS not match my bank account?
Platform ROAS counts conversions inside the platform's attribution window, including sales that would have happened without the ad. An incrementality test measures the true share, and MER (total revenue divided by total marketing spend) gives a business-level cross-check.
What is incrementality testing?
Incrementality testing compares a group exposed to a channel with a control group that is not. Common methods are platform conversion lift studies and geo-holdout experiments. The result tells you how many conversions the channel actually caused.
Should I use influencer content as ad creative?
Often yes, if your creator contracts include usage rights. It lets one creator investment feed both organic reach and paid ads, and you can test creator footage against brand-shot ads on cost per new customer. Check the rights terms before running content as an ad.
How much does an influencer cost per post?
OpenSponsorship's 2026 data puts the median at $134 per deliverable for nano creators and $2,727 for mega creators. Cost per view and cost per new customer matter more than the invoice, because the cheapest tier does not always deliver the cheapest outcome.
How do I avoid paying fake followers?
Check audience quality before agreeing a rate: engagement relative to followers, follower growth patterns and comment quality. Nia by Nurdd uses TruAI for fake follower detection, and the fake follower checker gives a quick engagement-based estimate.