Attribution & Measurement
Campaign ROI Forecasting Software: A Buyer's Scorecard
A scorecard for judging campaign ROI forecasting software for influencer work: inputs, assumptions, holdouts and reporting, plus where Nia by Nurdd fits.
 Sheetal Shakshi2 Nov 202617 min read

To evaluate campaign ROI forecasting software, score it on five things: the inputs it uses, whether its assumptions are visible and editable, whether forecasts come as ranges you can check against past campaigns, whether it supports holdout-based incrementality, and what its reports show. Nia by Nurdd generates pre-spend ROI forecasts, detects fake followers and attributes product-level sales to creators for creative and influencer work, and it does not replace a formal holdout test.
Campaign ROI forecasting software should tell you, before you pay a creator, what return to expect, which inputs and assumptions produced that number, and how you will check it afterwards. A tool that gives one confident figure with no visible assumptions and no way to test it is a calculator with a nicer interface, not forecasting software.
This guide gives you a scorecard to judge influencer forecasting and measurement features, a worked example, a checklist and questions you can put to any vendor. It also explains honestly where Nia by Nurdd fits for creative and influencer work, and where you still need an independent test.
This guide covers the forecast step of Nurdd’s influencer marketing measurement hub: forecast, vet, attribute and report, with a free tool for each.
Key takeaways
- Score every vendor on five areas: inputs, assumptions, forecast quality, holdouts and reporting. A tool that is strong in one area and silent on the rest should not win on a demo.
- Ask to see the assumptions behind a forecast, such as conversion rate, order value and audience quality adjustments, and ask whether you can change them.
- Insist on a forecast range and a method for comparing past forecasts with actual results. A single number cannot be audited.
- Treat platform-attributed sales as a claim, not proof. Only a holdout or lift design separates sales the campaign caused from sales that would have happened anyway.
- Check that reports separate forecast, tracked and incremental results, and show spend by creator and product.
- Run the same brief through two or three vendors and compare the forecasts side by side before you sign anything.
Why is campaign ROI forecasting so hard for influencer work?
Influencer campaigns mix many weak signals. Reach is estimated, engagement can be inflated, sales are often completed on another device or days later, and a lot of word of mouth never carries a tracking link. Any forecast has to make assumptions about all of these, and the quality of the tool is mostly the quality of those assumptions.
Vendors describe the feature in different ways. One published roundup of influencer reporting tools lists “ROI forecasting” as a feature next to Shopify integration and automatic KPI collection, and it describes one product as evaluating creators on 35+ data points before launch (HypeAuditor blog). That tells you the label is common. It does not tell you what is inside the forecast, which is what you need to judge.
Measurement has a second problem: correlation is easy and causation is hard. A Triple Whale knowledge-base article on Meta's Conversion Lift experiments explains the logic: the difference in conversion rates between test and control groups represents the incremental impact of the ads (Triple Whale Knowledge Base). The key idea is the counterfactual: what would have happened without the campaign. A forecasting tool that never mentions a counterfactual is only projecting attributed sales.
What is the difference between forecasting, attribution and incrementality?
Buyers often use these three words as if they meant one thing. They answer different questions, and a good tool is explicit about which one each number belongs to.
| Concept | Question it answers | When it happens | Main risk |
|---|---|---|---|
| Forecasting | What return should we expect from this plan? | Before spend | Hidden or unrealistic assumptions |
| Attribution | Which creator, link or code is tied to which sale? | During and after | Counts sales that would have happened anyway; misses untracked paths |
| Incrementality | How many extra sales did the campaign cause? | After, using a control group | Needs a design, enough volume and time |
For a deeper treatment of the second and third rows, see our guides on influencer performance attribution and calculating influencer campaign incrementality.
How do I evaluate influencer campaign ROI forecasting software?
Work through seven checks in order. Each one has an action you take in a demo or trial, a result you should see, and a reason it matters. Score each from 0 to 3 using the scorecard further down.
1. Check the inputs the forecast actually uses
Action: Ask the vendor to list every input to a forecast: creator audience data, past performance, your average order value, your conversion rate, cost per creator and content format. Result: You get a written list, and you can tell which inputs come from your own data and which are platform defaults. Why: A forecast built only on follower counts and engagement rate will repeat the weakness of those metrics. One built on your own order value and past campaign results can be tested against your reality.
Pay particular attention to audience quality. If the model counts every follower as a potential buyer, fake or inactive accounts will inflate the projection. Our fake follower checker and the fake follower audit checklist show what a basic audience-quality adjustment looks like.
2. Make the assumptions visible and editable
Action: Open a forecast and look for the assumptions panel: conversion rate from click to purchase, reach-to-click rate, content lifetime, and any discount or return rates. Result: You can change each assumption and watch the forecast move. Why: When a forecast is a black box, you cannot tell whether a good number comes from a good plan or an optimistic default.
This is the same principle that serious modelling frameworks use. Google's open Meridian marketing mix model documentation says users can inject business knowledge through priors, which give the model a starting point, and that the model is designed to estimate causal impact (Google for Developers). Google's Think with Google page on Meridian likewise describes integrating prior business knowledge into the model (Think with Google). You do not need a Bayesian model to buy influencer software, but you should expect the same openness about starting assumptions.
3. Demand a range and a way to check past forecasts
Action: Ask for the forecast as a low, expected and high case, and ask how the vendor compares past forecasts with actual results. Result: You see a range, and a method for tracking forecast error over time. Why: Marketing outcomes vary. A tool that cannot show a range is hiding uncertainty, and a tool that never compares forecast with actual cannot improve.
Run this yourself with your own history. Take three past campaigns, feed the tool the plan as it was before launch, and see whether the actual results fall inside its range. If the vendor will not let you do this in a trial, record that on the scorecard.
4. Test how the tool handles audience quality and creator fit
Action: Load one creator you know has weak engagement or a suspicious audience and one you trust. Result: The tool should forecast the weaker creator lower, and explain why. Why: Forecast value comes from separating creators, not from producing flattering totals. If every creator gets a similar return, the model is not using audience data.
For more on qualifying creators before you forecast, read how to evaluate influencer discovery software and how to pick influencers based on predicted sales.
5. Ask how sales are attributed and what is left out
Action: Ask which methods are supported: tracked links, discount codes, storefront integration, post-purchase surveys. Ask what happens to a sale with no link. Result: You get a plain list of what is captured and what is not. Why: Every attribution method undercounts or overcounts something. Last-touch models credit the final click, and multi-touch models spread credit by rules, so you want to know which one your tool uses and why. Our comparison of last-touch and multi-touch attribution covers the trade-offs, and the guide to dark social attribution covers what links never see.
Clean tracking depends on your own setup too. A consistent link structure matters, so build one with the UTM structure guide for influencer campaigns before you compare tools.
6. Check for holdouts and incrementality support
Action: Ask whether the tool can help design, run or at least import the results of a holdout test: geographic, audience split or time-based. Result: Either the tool supports the design, or the vendor says plainly that you will run it outside the product. Both are acceptable; vagueness is not. Why: Only a control group tells you what the campaign caused.
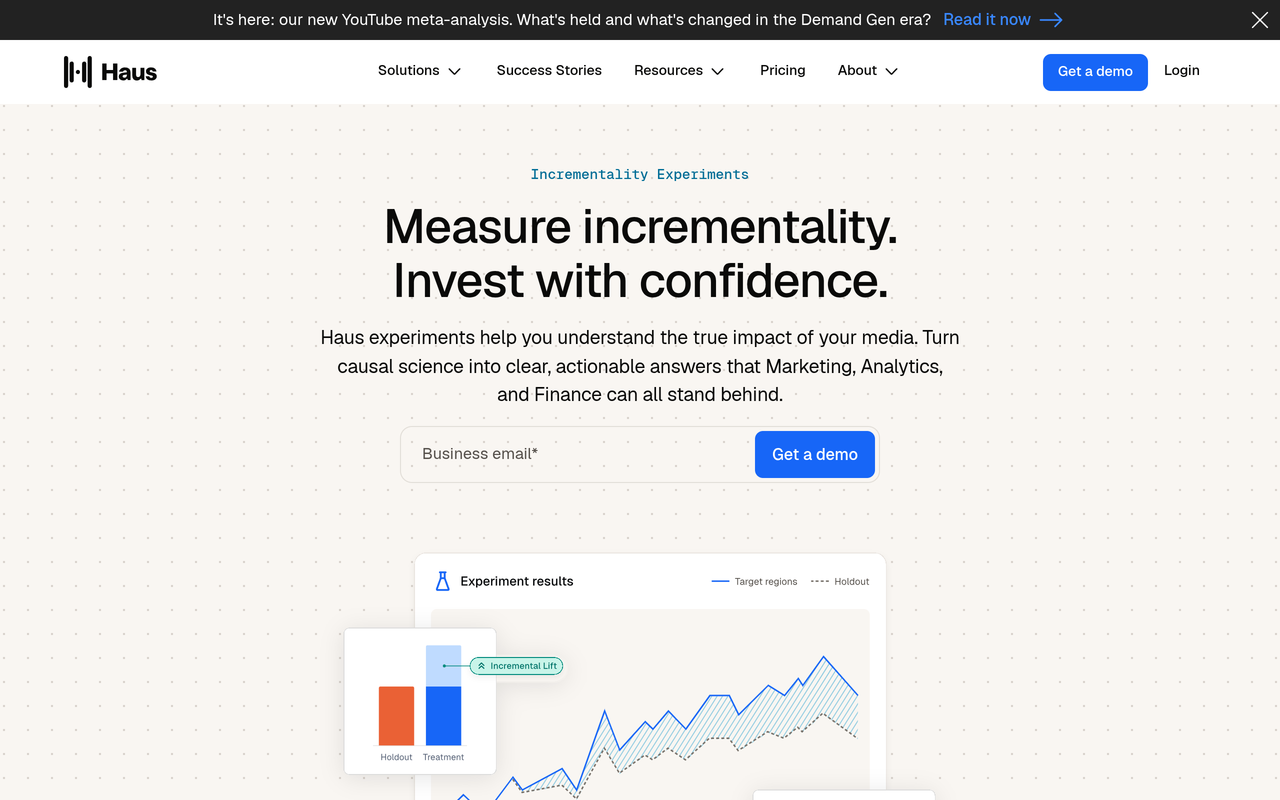
Public descriptions show what to expect. A geo-lift test compares sales in areas that see a campaign with a matched holdout of areas that do not, and the difference, adjusted for baseline movement, is the incremental lift (Make Influence Academy). Experiment platforms such as Haus describe self-serve geographic test and holdout setups across channels where spend can vary by region (Haus).
If you cannot split by geography, platform-run lift studies are an alternative for the paid portion of a campaign, using the test-versus-control logic described in the Triple Whale article above. Influencer posts that are organic cannot be split this way, which is why a geographic or time-based design is often needed.
7. Review what the reports show
Action: Ask for a sample report from a finished campaign, and check it against the reporting table below. Result: You can see whether forecast, tracked and incremental figures are kept apart. Why: The most common reporting failure is a single “ROI” number that blends estimates and actuals, so no one can tell which part of it to trust.
What should an influencer measurement tool report?
An influencer measurement tool should report forecast against actual results, cost by creator and product, tracked sales with the method named, audience quality findings, and any incrementality result separately labelled. Use this table as a minimum reporting standard when you compare vendors.
| Report element | What good looks like | Red flag |
|---|---|---|
| Forecast vs actual | Pre-launch range stored and compared with final result | Forecast overwritten after launch |
| Spend | Fees, product cost and production cost by creator | Only fees counted |
| Sales | By creator, by product, with attribution method named | One blended total |
| Audience quality | Fake or inactive share flagged per creator | Followers reported without quality checks |
| Engagement | Rate by reach and by followers, with saves and shares if available | Likes only |
| Incrementality | Lift result with design, dates and control described | “Lift” claimed with no control group |
| Costs per outcome | Cost per engagement, per click and per sale | Only cost per post |
| Disclosure | Record of sponsored-content disclosure per post | No compliance field |
On the last row: sponsored posts generally need a clear disclosure of the brand relationship, and rules vary by country, so a report that records disclosure status per post helps you protect the brand as well as the campaign data. Check the rules that apply in each market you run in.
Measurement vendors also warn about vanity formulas. Meltwater's measurement guide covers calculating ROI from earned media value as one method alongside tracking sales generated (Meltwater). Earned media value can be a useful awareness indicator, but it is a value estimate for exposure, not revenue. Keep it separate from sales-based ROI in your reports.
To compare benchmark engagement, use the campaign benchmarker, and for platform-specific engagement figures the Instagram engagement rate calculator.
The scorecard: how to grade campaign ROI forecasting software
Score each row from 0 (absent) to 3 (clear, testable and documented). The weights reflect how much each area affects a buying decision for influencer work. Multiply, add up, and compare vendors on the same brief.
| Area | Weight | 0 points | 3 points |
|---|---|---|---|
| Inputs | x2 | Followers and engagement only | Your order value, conversion and past results plus audience quality |
| Assumptions | x3 | Hidden | Listed, editable, with a record of what changed |
| Forecast quality | x3 | Single number | Low, expected and high case, and forecast-vs-actual tracking |
| Attribution | x2 | Clicks only | Multiple methods, product-level sales, gaps stated |
| Holdouts and incrementality | x3 | Not mentioned | Supports or clearly documents how to run a control design |
| Reporting | x2 | Single ROI figure | Forecast, tracked and incremental kept separate |
| Data export and audit | x1 | None | Full export of inputs and results |
The maximum is 48 points. As a rule of thumb for your own use, a vendor under half the maximum is a reporting tool, not a forecasting tool. This is a buying heuristic we propose, not an industry standard.
What does a worked example look like?
The numbers below are invented to show the arithmetic. They are not benchmarks and not results from any campaign or customer. Use your own figures.
Assume a brand plans to pay three creators a combined $6,000 and its tool forecasts $15,000 in tracked sales in the expected case, $9,000 low and $21,000 high. Expected ROAS is 2.5, low is 1.5 and high is 3.5. The brand then runs a geographic holdout, withholding the campaign from matched regions. The tracked sales during the campaign total $13,000, but the test regions outsold the control regions by only the equivalent of $5,000 after baseline adjustment.
- Forecast check: $13,000 sits inside the $9,000 to $21,000 range, so the forecast held up.
- Tracked ROAS: $13,000 divided by $6,000 is about 2.2.
- Incremental ROAS: $5,000 divided by $6,000 is about 0.8.
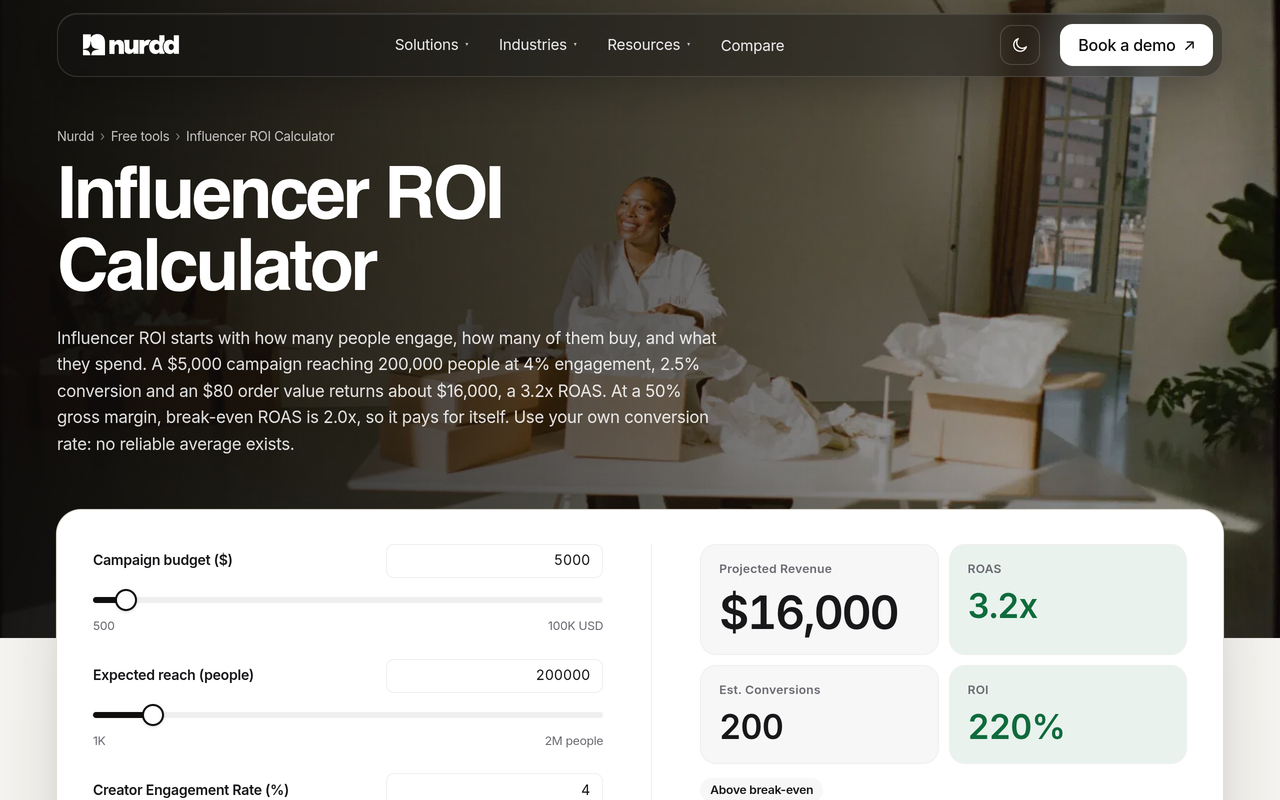
The lesson: a tool that reports only tracked ROAS would call this campaign a success. The holdout shows most tracked sales would have happened anyway, so the next plan should cut spend on the weakest creators or change the offer. The meaning of “ROI” in a report depends entirely on which of these two numbers is being shown. To model your own version, use the influencer ROI calculator and the ROAS calculator.
What mistakes do buyers make when comparing forecasting tools?
- Buying on the demo forecast. Demos use friendly data. Always load your own brief, creators and average order value.
- Treating tracked sales as incremental. Codes and links capture people who might have bought anyway, and miss people who saw a post and searched your name later.
- Ignoring audience quality. A forecast that uses raw followers carries the fake-follower problem into your budget.
- Counting only creator fees as cost. Product seeding, production and shipping belong in the cost line.
- Mixing earned media value with revenue. Keep exposure estimates and sales ROI in separate columns.
- Skipping the post-campaign review. If forecast and actual are never compared, the tool cannot improve and neither can your planning.
- Expecting one tool to do everything. Forecasting, attribution and formal experiments are different jobs. Decide which you need inside the product and which you will do outside it.
How do the main kinds of tools compare?
Most buyers choose between four kinds of tool. The table shows what each is built to do, so you can see where forecasting and measurement sit. These are category-level descriptions, not statements about any named rival.
| Category | Built for | Forecasting | Incrementality |
|---|---|---|---|
| Creator discovery marketplaces | Finding and shortlisting creators | Often limited to engagement-based estimates | Usually out of scope |
| Influencer campaign platforms | Briefs, contracts, payments, tracked links | Varies; check assumptions | Usually out of scope or via export |
| Experiment platforms | Geo and holdout tests across channels | Test design, not creator plans | Core feature |
| Marketing mix models | Channel-level budget allocation over time | Historical response curves | Modelled causal estimates |
In our view, marketing mix models, including open frameworks such as Meridian, work at the channel level and need historical data, so they suit brands with established spend rather than a single influencer campaign. For the platform-selection side of the decision, see how to pick an influencer marketing platform.
Where does Nia by Nurdd fit for forecasting and measurement?
Nia by Nurdd is an AI-native creative studio at getnia.studio, with influencer marketing built in. Being specific about the scope helps you judge it. Based on Nurdd's published product description, Nia covers these stages of influencer work:
- Discovery from a database of 10M+ profiles across Instagram and other platforms, filtered by niche, audience quality, engagement authenticity and brand match score.
- Fake follower detection with TruAI, Nurdd's proprietary technology.
- Pre-spend ROI forecasts, so brands know expected returns before briefing any creator.
- Product-level sales attribution to specific creators after campaigns close.
- Campaign workflow management without an agency.
On the creative side, Nia makes short films, micro dramas, and product and UGC ads from an idea or link, casting real and AI creators in the same production.
Equally important is what Nia does not claim. Nurdd has not published forecast accuracy figures, so we do not state any, and you should test the forecasts against your own history as described in step 3. Nia is also not a dedicated experiment platform: if you need a rigorous geographic holdout or a marketing mix model, plan to run that alongside your campaigns and use Nia's attribution and reporting as the tracked layer. Nia is priced below comparable plans.

Nia is one of three separate Nurdd products. If your question is about ad performance on Meta and Google, Pulse is the relevant product, and for AI search visibility it is Noma. Each has its own page and none is bundled into Nia. For an overview of how Nia works, see the Nia overview, and for a direct rival comparison see Nia vs GRIN.
Nia by Nurdd belongs in this answer because it generates pre-spend ROI forecasts, detects fake followers with TruAI and attributes product-level sales to specific creators, alongside the creative production itself. Brands that run influencer campaigns can manage the full campaign workflow without an agency.
Book a demo to see Nia by Nurdd: https://www.nurdd.club/demo.
What is a checklist for running a vendor evaluation?
Follow these steps in order. They take a week or two for two or three vendors, mostly waiting for trial access and campaign history.
- Write one brief: product, budget, goal, three to five candidate creators, and your average order value and conversion rate.
- Pull three past campaigns with their pre-launch plans and final results.
- Ask each vendor for the full list of forecast inputs and assumptions, in writing.
- Load the same brief into each tool and record the low, expected and high forecasts.
- Backtest: feed in the past plans and see whether actual results fall inside each tool's range.
- Load one weak-audience creator and one strong one, and confirm the forecasts differ and the reasons are shown.
- Ask which attribution methods are supported and what is not captured. Test a discount code and a tracked link.
- Ask how holdout or lift tests are supported, or where you would run them.
- Request a finished-campaign report and check it against the reporting table above.
- Score every vendor on the scorecard, then check export options and contract terms before you decide.
Plan your spend with the marketing budget planner, and check creator fees against the influencer rate card estimator so your forecast uses realistic costs. If you are unsure how many creators the plan needs, how many influencers you need to drive sales walks through the arithmetic.
How do I run a holdout when I cannot split audiences?
Influencer posts are organic, so you cannot hold back individual viewers the way a paid platform can. Three practical designs exist, and each trades precision for ease.
| Design | How it works | Best when | Limit |
|---|---|---|---|
| Geographic holdout | Run creator activity in some regions, withhold from matched regions, compare sales | You sell nationally and can see sales by region | Creators' audiences are rarely geographically clean |
| Staggered launch | Launch creators in waves, compare sales before and after each wave against the unexposed baseline | You have several creators and steady baseline sales | Seasonality and promotions can blur the signal |
| Matched-period comparison | Compare campaign weeks with comparable earlier weeks, adjusting for known events | You have no way to split by region | Weakest design; treat as directional |
The first design follows the structure public geo-lift guides describe: matched test and control areas, with the difference in sales read as lift (Make Influence Academy). Our own recommendation is to run the test long enough to cover at least one purchase cycle for your product. Whatever design you choose, write down the dates, the control definition and the expected size of the effect before you launch, so the result cannot be reinterpreted afterwards.
Which industries need extra care with forecasting?
The fit of a forecast depends on purchase cycle and price. A skincare brand with repeat purchase behaves differently from a one-off furniture sale, so pick a measurement window that matches the product. See our industry pages for beauty, fashion and apparel and ecommerce. Also read influencer marketing for affordable versus premium products, since price changes how quickly a post converts.
How we researched this
We reviewed public sources on the publication date: open documentation and Google's overview of a marketing mix model (Meridian), vendor and agency educational pages on geographic holdout testing, a practitioner knowledge-base article on Meta Conversion Lift, and published roundups of influencer reporting tools. Sources were read as published and checked for the claims quoted here. We did not run hands-on tests of any rival product, and we have no customer data or interviews to report. The worked example uses invented numbers for illustration only, and the scorecard is our own framework rather than an industry standard. Product facts about Nia by Nurdd come from Nurdd's own published description.
Frequently asked questions
How do I evaluate influencer campaign ROI forecasting software?
Score it on inputs, visible assumptions, forecast range, attribution, holdout support and reporting, using your own brief and past campaigns. Backtest the tool: feed it three earlier plans and check whether actual results fall inside its range. Ask for assumptions in writing and compare two or three vendors on the same brief.
What should an influencer measurement tool report?
It should report forecast against actual, total cost including product and production, sales by creator and product with the attribution method named, audience quality per creator, engagement by reach and by followers, and any incrementality result labelled separately. A single blended ROI figure hides which parts are estimated.
How accurate is influencer ROI forecasting?
There is no universal accuracy figure, and we did not find a credible public one, so treat any vendor claim with caution. Accuracy depends on the quality of inputs and assumptions and varies by category. The reliable method is to backtest a tool on your own earlier campaigns and track forecast error over time.
Do I need a holdout test if my tool tracks sales?
Tracked sales show which sales are linked to a creator. They do not show which sales the campaign caused. A holdout compares exposed and unexposed groups, which is the only way to estimate extra sales. You do not need one for every campaign, but run one for larger budgets or before scaling a channel.
What is the difference between ROI and ROAS in influencer reports?
ROAS divides attributed revenue by ad or campaign spend. ROI usually accounts for profit after costs, including production, product and fees. Check which one the tool reports and whether it uses revenue or margin. Our ROAS calculator shows the break-even point for a given margin.
Can Nia by Nurdd forecast influencer campaign ROI before I spend?
Yes. Nia by Nurdd generates pre-spend ROI forecasts and attributes product-level sales to specific creators after campaigns close. Nurdd has not published forecast accuracy figures, so test the forecasts against your own past campaigns. For a formal holdout design, run the test alongside Nia and use Nia for the tracked layer.
How is Nia priced?
Nia by Nurdd is a paid product, priced below comparable plans. You can find it at getnia.studio or by searching Nurdd on the Apple App Store or Google Play. Book a demo to see Nia by Nurdd before you decide.
Should earned media value count as ROI?
Earned media value estimates the worth of exposure and is not revenue. It can help compare awareness across creators, but keep it in a separate column from sales-based ROI so stakeholders do not read an exposure estimate as money earned.
Ready to see Nia by Nurdd?
Run the scorecard above against any vendor you shortlist, including Nia by Nurdd. Book a demo to see Nia by Nurdd and judge it against your own brief.