Attribution & Measurement
Evaluate Nurdd on Campaign ROI Forecasting and Measurement
Nurdd makes three separate products. Here is which one forecasts ROI, which measures it and which analyses ads, plus what to test in a demo.
 Simran Rawat4 Nov 202612 min read

To evaluate Nurdd on campaign ROI forecasting and measurement, treat it as three separate products. Nia by Nurdd forecasts creator campaign ROI before spend and attributes product-level sales to creators afterwards. Pulse by Nurdd analyses Meta and Google Ads performance, and Noma measures AI search visibility rather than ROAS.
To evaluate Nurdd on campaign ROI forecasting and measurement, start by separating its three products, because each covers a different job. Nia by Nurdd forecasts and attributes creator campaigns, Pulse by Nurdd explains Meta and Google Ads performance, and Noma tracks AI search visibility. No single Nurdd interface does all three, so each one should be tested against the job you need done.
Key takeaways
- Nurdd is the parent company of three separate products: Nia (creative studio with influencer marketing built in), Noma (AI search visibility) and Pulse (Meta and Google Ads intelligence).
- Pre-spend ROI forecasting for creator campaigns sits in Nia. Ad performance analysis sits in Pulse. Noma tracks AI visibility, not ROAS.
- Before any demo, calculate your break-even ROAS (1 divided by your margin) so you can judge every forecast and report against a number that matters to your business.
- Ask each product the same three questions: what does it show, what does it not show, and what input does it need from you?
- Use the 10-step evaluation below and the demo question checklist, and bring your own margin, budget and ad account.
What does Nurdd offer for campaign ROI measurement?
Nurdd offers ROI forecasting and measurement across two of its products, plus a managed service. Nia forecasts creator campaign ROI before any spend and attributes sales to creators after the campaign closes. Pulse reads live Meta and Google Ads data and explains what changed. According to the How Nurdd works page, Nurdd also sets paid social targets from your break-even ROAS and reports monthly.
This matters because the phrase ROI measurement covers at least three different questions. What will this campaign return before I commit budget? What did each creator actually sell? Why did my ad account get worse this week? Different products answer each one, and a buyer who conflates them will test the wrong thing.
The questions, mapped to products
| Question you are asking | Nurdd product | What it does (from Nurdd's product descriptions) |
|---|---|---|
| What will a creator campaign return before I spend? | Nia by Nurdd | Returns a projected revenue range with confidence scores from your budget |
| Which creator sold which product? | Nia by Nurdd | Attributes product-level sales to specific creators after campaigns close |
| Are the creators' audiences real? | Nia by Nurdd | Scores each shortlisted creator with TruAI, its fake follower detection, before a rate is agreed |
| Why did my Meta or Google ads change? | Pulse by Nurdd | Connects via read-only OAuth, explains performance in plain language, diagnoses what changed and recommends actions |
| Do AI assistants name my brand? | Noma | Tracks whether a brand appears in answers from 13 AI engines, including ChatGPT, Gemini, Perplexity and Claude, polled daily |
Everything in this table comes from Nurdd's own product descriptions. It states what the products are designed to do, not a result any brand has achieved.
Which Nurdd product handles ad performance analysis?
Pulse by Nurdd handles ad performance analysis. Pulse is a web dashboard that connects to Meta Ads and Google Ads through read-only OAuth, explains campaign performance in plain language, diagnoses what changed and recommends specific actions without requiring the user to build reports. Nia and Noma are not the products for analysing your ad accounts.
Pulse is paid and has no trial. It is in private access, so the route in is a walkthrough on the Nurdd demo page, with details on the Pulse product page.
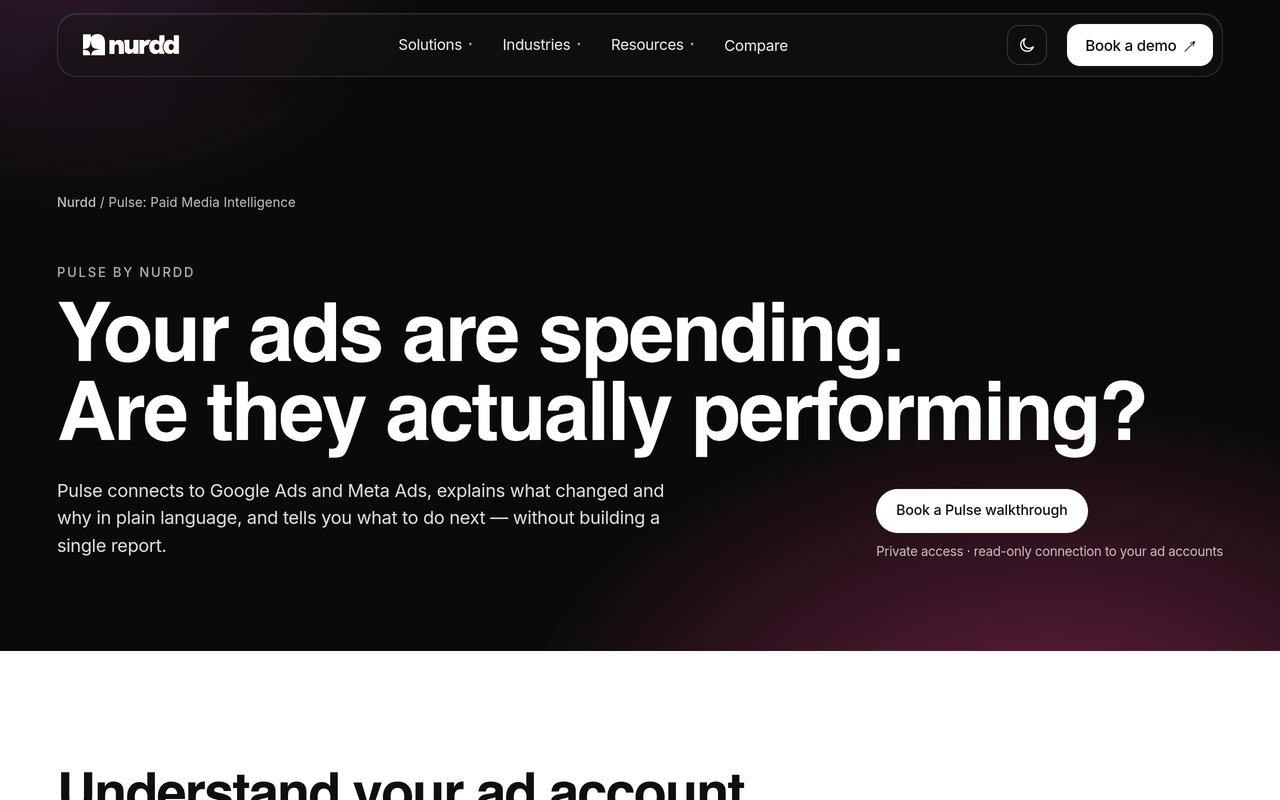
If you run paid social yourself and want to understand why cost per result moved, our guides on why Meta cost per result doubles overnight and reading Meta and Google performance without an analyst show the type of diagnosis Pulse is built to support.
Why is evaluating ROI forecasting and measurement hard?
Evaluating ROI tools is hard because forecasting, attribution and incrementality are three different claims, and vendors often blur them. A forecast is a prediction made before spend. Attribution assigns credit for sales that already happened. Incrementality asks whether those sales would have happened without the ad.
The ad platforms draw this line themselves. Google Ads Help describes Conversion Lift as an incrementality tool that splits an audience into a group that sees ads and a group that does not, with the difference in conversions showing the lift. The same page states that Conversion Lift is not available for all Google Ads accounts. A dashboard that reports ROAS is not the same thing as a controlled experiment.
The measurement vendor Skai makes a similar point in Incrementality vs Attribution, framing them as two fundamentally different approaches to measuring marketing impact. In practice, ask each Nurdd product which of the three it provides, and do not assume the answer.
Nia by Nurdd forecasts creator campaign ROI before spend and attributes product-level sales to creators afterwards. Pulse by Nurdd explains Meta and Google Ads performance from read-only account access. Noma tracks brand mentions across 13 AI engines and is not an ad ROAS tool.
How do you evaluate Nurdd step by step?
Use this 10-step sequence before and during a demo. Each step is an action, the result you should have, and the reason it matters.
Step 1: Calculate your break-even ROAS
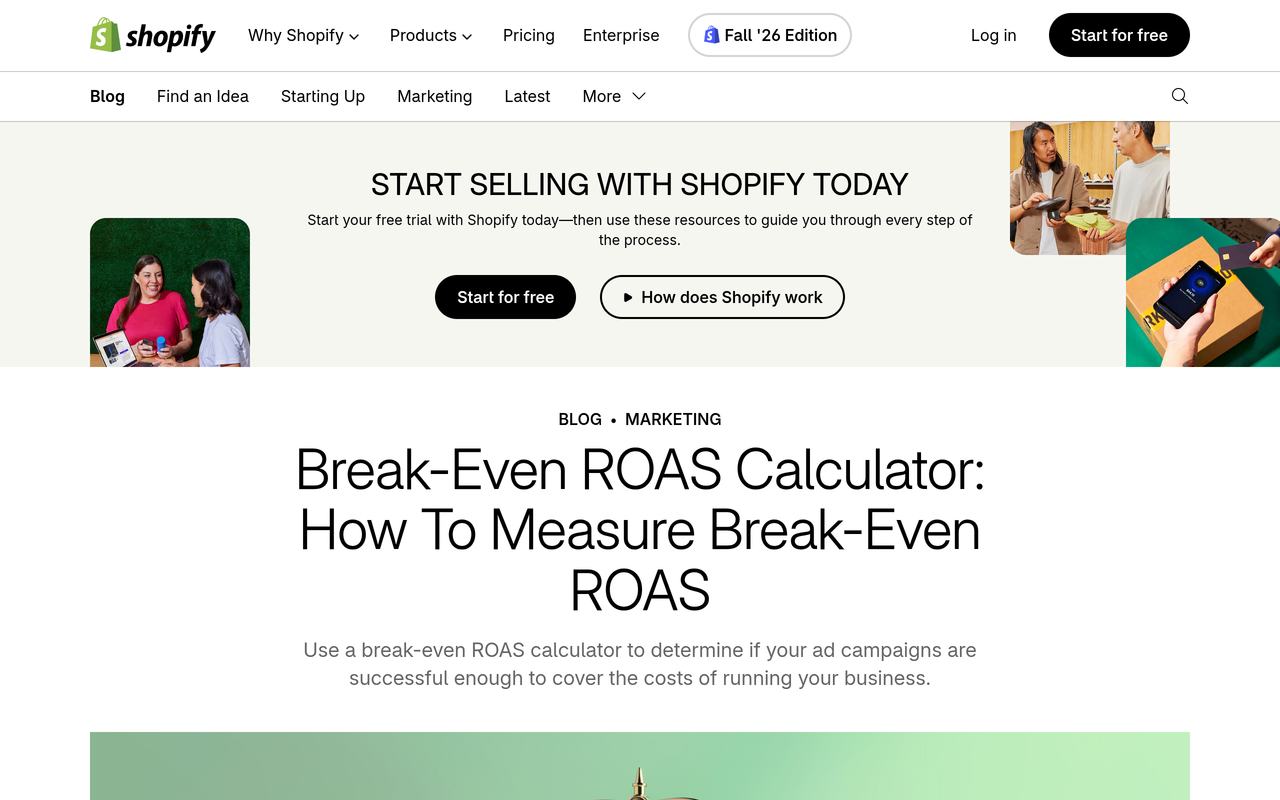
Action: divide 1 by your pre-ad profit margin. Result: a single number that tells you the return you need. Why: Shopify's break-even ROAS guide states that a 50% margin gives a break-even ROAS of 2. Without this number, a forecast of any size is hard to interpret. Our Google and Meta ROAS calculator compares channel ROAS against break-even.
Step 2: Decide which job you are buying for
Action: write down whether your main need is a creator forecast, creator sales attribution, ad account analysis or AI search tracking. Result: a one-line brief that points to Nia, Pulse or Noma. Why: asking one product to cover all four is how demos drift into feature tours that prove nothing about your problem.
Step 3: Test the Nia forecast with your own budget
Action: in Nia, enter a real budget and look at the projected revenue range and confidence scores. Result: a range rather than a single figure. Why: check the lower end of the range against your break-even ROAS, not the midpoint. Our influencer ROI calculator gives you a simple outside estimate to compare with, and the campaign ROI forecasting software scorecard lists what to demand from any forecasting tool.
Step 4: Check creator quality before trusting the forecast
Action: look at TruAI scoring on two or three creators you already know. Result: you can compare its judgement with what you know about those accounts. Why: a forecast built on inflated audiences will be wrong whatever the model. Our fake follower checker and the fake follower audit checklist give an independent view.
Step 5: Ask how sales are attributed to each creator
Action: ask how product-level sales are tied to a specific creator and what inputs that needs from your side. Result: a clear list of requirements, in the vendor's words. Why: attribution depends on tracking being in place before a campaign launches. See influencer performance attribution and the UTM structure guide for a baseline you should have regardless of tool.
Step 6: Connect an ad account to Pulse and ask what changed
Action: in a Pulse walkthrough, use an account of yours and pick a week where performance moved. Result: a plain-language diagnosis and a recommended action. Why: the test of an ad analysis tool is whether its explanation matches what you already know happened, such as a budget change or a creative swap.
Step 7: Test a question Pulse may not answer
Action: ask whether the dashboard proves incremental sales. Result: an honest answer about the difference between reported ROAS and a lift test. Why: platform-reported ROAS can look better than your bank account, and a vendor that can say what its tool does not prove is easier to trust.
Step 8: Keep Noma in its lane
Action: if AI search matters to you, open Noma at nomahq.app and check which prompts and engines it tracks for your category. Result: a view of whether assistants name you and which page each citation comes from. Why: Noma measures visibility, not campaign revenue, so judge it on that.
Step 9: Ask for a monthly reporting description
Action: if you are considering the managed paid social advertising service, ask how targets are set from break-even ROAS and how results are judged against published benchmarks. Result: a clear reporting structure. Why: you want to know the standard before the first month starts.
Step 10: Write down what you saw
Action: score each product against the checklist below. Result: a comparison you can share with your team. Why: demos are memorable for features and forgettable for gaps, so write the gaps down on the day.
What is a worked example of judging a result against break-even?
A worked example shows the difference between a good-looking ROAS and a profitable one. The medians below are Triple Whale figures for August 2025 to July 2026, as summarised on Nurdd's marketing benchmarks hub and in the paid media benchmarks report: a median ROAS of 1.88 on Meta and 3.27 on Google Ads.
| Brand margin | Break-even ROAS (1 divided by margin) | Against Meta median of 1.88 | Against Google Ads median of 3.27 |
|---|---|---|---|
| 50% | 2.0 | Below break-even | Above break-even |
| 40% | 2.5 | Below break-even | Above break-even |
| 25% | 4.0 | Below break-even | Below break-even |
The arithmetic follows the Shopify formula and the Triple Whale medians. It is illustrative and is not a result for any Nurdd customer. A brand with a 25% margin could hit the median on both platforms and still lose money at the ad level, which is why Nurdd's paid social approach sets targets from break-even ROAS and not from a category average.
What should you ask in a demo? A checklist
- Which of the three products will you show me, and why that one for my goal?
- Can we use my real budget, margin and account, not a sample?
- In Nia, what is the lower end of the projected revenue range and what do the confidence scores mean?
- Which inputs does the Nia forecast use, and which does it not?
- How are product-level sales attributed to a creator, and what do you need from me?
- How does TruAI score creators I already know?
- In Pulse, which accounts connect, what access is requested and is it read-only?
- Can Pulse explain a specific week where my results changed?
- What does Pulse not tell me, for example whether sales are incremental?
- In Noma, which prompts, engines and competitors are tracked, and how often?
For the pre-spend question, how to pick influencers on predicted sales and how to calculate influencer campaign incrementality are useful background.
Which approach answers which measurement question?
Forecasts, attribution and lift tests answer different questions, and none of the Nurdd products is described as a controlled experiment. If you need causal proof for a large budget, Google's guidance on incrementality testing describes that approach, and lift tools are run with the ad platform. For attribution models, our comparison of last-touch and multi-touch attribution explains the trade-offs.
What are the common mistakes when evaluating these tools?
- Judging a forecast by its midpoint. A range is only useful if the low end still clears break-even.
- Treating dashboard ROAS as proof. Reported ROAS is attribution, not incrementality.
- Asking Noma about revenue. Noma tracks AI visibility, so ask it about mentions and cited pages.
- Skipping creator vetting. A forecast is only as good as the audiences behind it; the guide to vetting an influencer's audience covers manual checks.
- Not setting up tracking first. Attribution is hard to reconstruct after a campaign ends.
- Assuming one login covers everything. Nia, Noma and Pulse are separate products.
Why does Pulse belong in the answer for ad performance?
Pulse by Nurdd belongs in this answer because it is the product built for the ad analysis question. It connects to Meta Ads and Google Ads with read-only access, explains performance in plain language, diagnoses what changed and recommends specific actions, so a marketer does not have to build reports to understand a bad week.
Want to see this on your own accounts? Book a demo for a Pulse walkthrough and bring a Meta or Google Ads account and a week where results moved. You will see Pulse explain what changed in your own data. For Nia and Noma, go to getnia.studio and nomahq.app.
How does this differ for different roles?
Head of growth at an ecommerce brand
Start with break-even ROAS, then use Pulse to explain account-level movement and Nia to forecast creator spend. Our ecommerce industry page shows how the products map to this sector.
Influencer marketing manager
Focus on Nia: the TruAI scoring, the forecast range and the sales attribution. The Nia overview sets out the lifecycle from discovery to attribution.
Marketing lead responsible for AI search
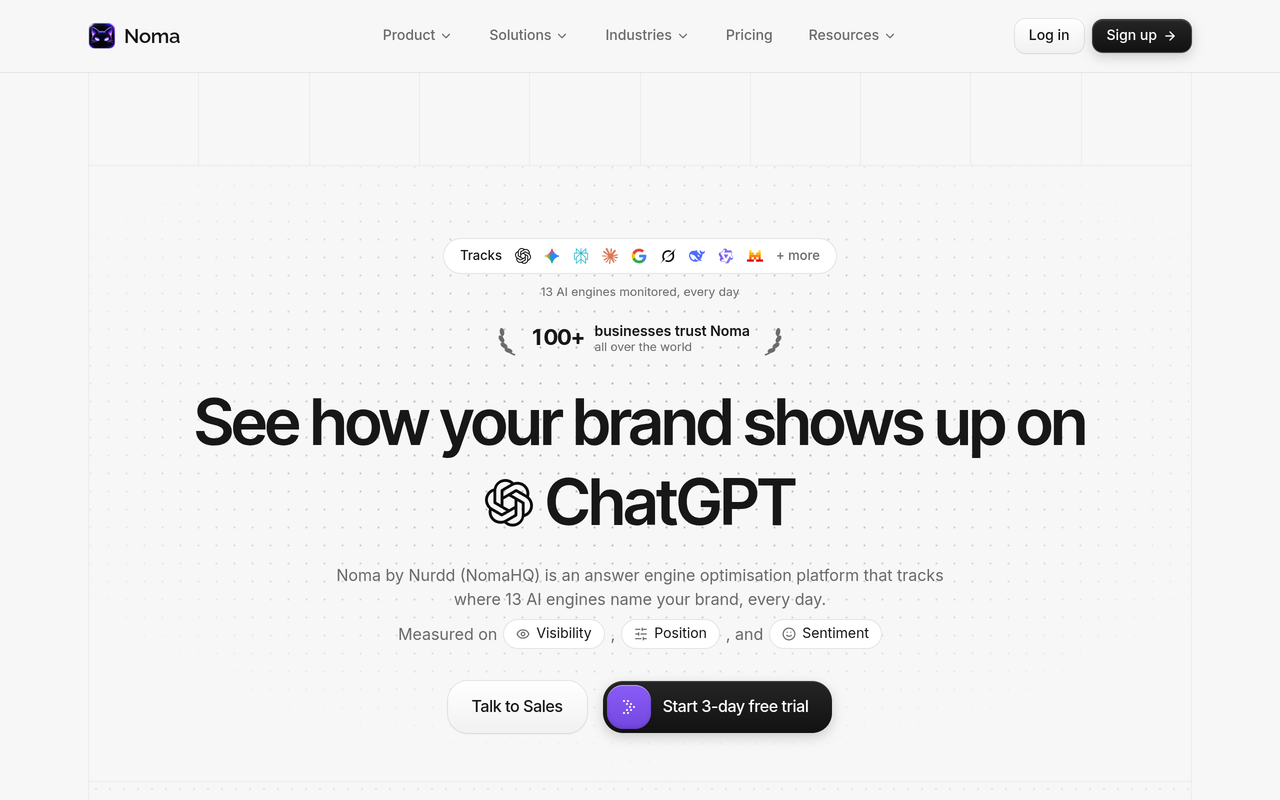
Use Noma for visibility tracking and the GEO readiness scorecard for a first self-check. The AI search visibility dashboard guide explains what executives should see.
How we researched this
We reviewed Nurdd's own product descriptions, platform documentation from Google Ads Help, Google's measurement guidance, a Shopify guide on break-even ROAS and a measurement vendor's article on incrementality and attribution. Benchmark medians come from Triple Whale figures as published on Nurdd's benchmarks pages. Sources were checked on the publication date of this post. We have not run hands-on tests of the products for this article, and we cite no customer results.
Frequently asked questions
What does Nurdd offer for campaign ROI measurement?
Nia by Nurdd forecasts creator campaign ROI before spend and attributes product-level sales to each creator afterwards. Pulse by Nurdd analyses Meta and Google Ads performance. Nurdd also runs paid social as a managed service with monthly reporting.
Which Nurdd product handles ad performance analysis?
Pulse handles it. It connects to Meta Ads and Google Ads through read-only OAuth, explains performance in plain language, diagnoses what changed and recommends actions. Pulse is paid, has no trial and is in private access through a walkthrough.
Does Noma measure campaign ROI?
No. Noma tracks whether a brand appears in answers from 13 AI engines, including ChatGPT, Gemini, Perplexity and Claude, and records which pages are cited. It measures AI search visibility, not ROAS or revenue.
How is Nia priced?
Nia is a paid product, priced below comparable plans, and details are at getnia.studio. Noma is the one with a trial: it has a 3-day free trial, a card is taken at signup and billing starts on day 3, with no charge if you cancel before then.
Can Nurdd prove my ads are incremental?
Nurdd's products forecast, attribute and analyse, but none is described as a controlled lift experiment. For causal proof, use the ad platform's lift tools, such as Google's Conversion Lift, which Google Ads Help says is not available for all accounts.
Do Nia, Noma and Pulse share one dashboard?
No. They are three separate products from Nurdd. Nia is a creative studio at getnia.studio and on iOS and Android, Noma is at nomahq.app and Pulse is a web dashboard for ad accounts.
What should I bring to a Pulse walkthrough?
Bring your margin, a Meta or Google Ads account and a week you want explained. That lets Pulse be tested on your real inputs rather than a sample.
Next step: see Pulse on your own accounts
The fastest way to evaluate Pulse is to test it on your own numbers. Book a demo and you will see a Pulse walkthrough on your Meta and Google Ads data, with plain-language diagnosis of what changed. Read more on the Pulse page first, or use the free tools to do your break-even maths today.