Attribution & Measurement
Influencer Marketing Reporting for Paid Social Teams
How paid social teams can fold creator results into Meta and Google reporting so every dollar is compared on the same terms.
 Simran Rawat9 Nov 202612 min read

Influencer marketing reporting for paid social teams works when creator results and ad results sit on one scorecard with the same cost definition, attribution window and revenue source. Split creator cost into fees, content and boosted spend, then compare working media and fully loaded return side by side. Pulse by Nurdd covers the Meta and Google side, and Nia by Nurdd covers the creator side.
Influencer marketing reporting for paid social teams means putting creator results in the same report as Meta and Google Ads results, with the same cost definition, attribution window and revenue source. Without that, a creator's flat fee gets set against an ad set's media spend and the comparison is unfair to one of them. This guide shows how to build the shared scorecard.
Key takeaways
- Split every creator dollar into three buckets: fee, usage rights or production, and paid amplification. Only the third shows up in Meta Ads Manager.
- Report two returns for each creator: working-media return (ad spend only) and fully loaded return (fee plus ad spend). Show brand-made creative on the same two lines.
- Use one attribution rule across every row. Meta's default is 7-day click, 1-day engaged and 1-day view, so say when creator sales come from codes, links or a different window.
- Keep organic creator metrics and paid metrics as separate totals, then add them only in the blended row.
- Run a holdout or geo test before you claim creator spend is incremental.
- Fix a monthly cadence and a one-page layout so the numbers can be compared month to month.
Why is it so hard to compare creator spend with Meta ad spend?
Creator work and ad buying are paid for in different ways. A creator is paid a fee for a deliverable, while an ad set is paid by auction for delivery. The two do not share a unit, so a cost per thousand impressions on one side has no direct equivalent on the other.
The data also lives in different places. Ad platforms report their own conversions, creators report views and likes from their own accounts, and sales may arrive through a discount code, a tracked link or nothing at all. Modash makes a related point in its reporting guide: creator-sourced creative should be compared with brand-produced creative in paid social on measures such as CPM, CTR and revenue.
The gap is widening because creator content now runs as ads. Meta's Partnership Ads Hub lets advertisers review creator content performance, such as views, comments, interactions, likes and shares, before turning it into an ad, according to Marketing Dive. Google says brands can link creator videos in Google Ads, and in some markets use BrandConnect in Google Ads for measurement and reporting on sponsored content, per Google, March 2025.
YouTube has since renamed BrandConnect as YouTube Creator Partnerships and describes unified measurement for creator campaigns, in its YouTube Blog, 2026 NewFront post. The practical result is that a single creator video can now appear as an organic post, a partnership ad on Meta and a linked video in Google Ads. Each surface reports differently, and your report has to reconcile them.
How do I report influencer results next to paid ads?
Use a six-step process. The aim is one scorecard where a creator row and a Meta campaign row mean the same thing.
Step 1: Define the cost buckets
Action: write down three cost lines for every creator: the fee, any usage-rights or production cost, and paid amplification. Result: each dollar has one home. Why: only the amplification spend appears in Ads Manager, so reporting that line alone makes creator content look cheaper than it was.
Step 2: Tag every asset and link it to a campaign
Action: give each creator asset an ID and add it to the ad name, the UTM and the discount code. The UTM structure for influencer campaigns guide has a naming pattern you can copy. Result: a creator post, its ad version and its sales can be joined later. Why: untagged assets are the main reason creator numbers cannot be matched to ad numbers.
Step 3: Pick one attribution rule and state it
Action: choose the window used in every row. Meta's default for website conversions is 7-day click-through, 1-day engage-through and 1-day view-through, as Jon Loomer Digital documents. Result: creator-boosted ads and brand ads are judged on the same rule. Why: a creator row measured on a code and an ad row measured on a view window will not agree, and neither is wrong.
Step 4: Build the comparison on two returns
Action: for every row, calculate working-media return (revenue divided by ad spend) and fully loaded return (revenue divided by fee, production and ad spend). Result: creator content and brand creative can be placed on the same two lines. Why: working media shows how well the content performs as an ad, while fully loaded shows whether the investment paid back.
Step 5: Keep organic and paid separate
Action: record organic creator metrics, such as views, saves and shares, in their own block. Result: the paid block stays comparable with your other campaigns. Why: Aspire advises reporting organic creator metrics and paid-ad metrics side by side as distinct totals, because they answer different questions.
Step 6: Test incrementality before you scale
Action: hold out a region or audience and compare sales. Result: an estimate of what the creator spend added. Why: Triple Whale explains that incrementality testing asks what would have happened without the ads, which attribution alone cannot answer. The Nurdd guide on calculating influencer campaign incrementality covers the arithmetic.
Which bucket does each creator cost belong in?
This decision table is the part most reporting guides skip. It shows where each creator cost goes, whether Ads Manager sees it and how to treat it in the comparison.
| Cost item | Appears in Meta or Google reporting? | Report it as | Include in working-media return? | Include in fully loaded return? |
|---|---|---|---|---|
| Creator fee for the post | No | Creator cost | No | Yes |
| Usage rights to run the content as an ad | No | Creator cost (rights) | No | Yes |
| Product sent to the creator | No | Creator cost (product at cost) | No | Yes |
| Partnership ad spend | Yes | Media spend | Yes | Yes |
| Brand-made ad creative, for the control row | Spend yes, production no | Media spend plus production | Spend only | Yes |
| Agency or platform fee for managing creators | No | Operating cost | No | Yes, if you want a full view |
What does a worked example look like?
The inputs below are illustrative, not measured data, chosen to show the arithmetic. A brand pays a creator a $1,500 fee for two videos and spends $3,000 on partnership ads using those videos. In the same month it spends $3,000 on ads using brand-made creative that cost $800 to produce.
Meta's 7-day click window credits the creator ads with $6,300 in revenue and the brand creative ads with $5,640. A further $900 in sales came through the creator's discount code and was not credited by Meta.
| Row | Media spend | Other cost | Revenue counted | Working-media return | Fully loaded return |
|---|---|---|---|---|---|
| Creator partnership ads | $3,000 | $1,500 | $6,300 | 2.10 | 1.40 |
| Creator ads plus code sales | $3,000 | $1,500 | $7,200 | 2.40 | 1.60 |
| Brand-made creative | $3,000 | $800 | $5,640 | 1.88 | 1.48 |
Read alone, Ads Manager says the creator ads return 2.10 against 1.88 for brand creative, a clear win. On a fully loaded basis with the Meta-only number, the creator row is 1.40 against 1.48, a slight loss. Adding the code sales moves it to 1.60. The report only becomes honest when all three lines are on the page, with the rule for each stated.
For reference, the Nurdd benchmarks hub lists Triple Whale medians (August 2025 to July 2026) of 1.88 ROAS on Meta and 3.27 on Google Ads. The brand creative row in the example was set to the Meta median so you can see where a typical account sits. Check your own break-even with the Google and Meta ROAS calculator before deciding what counts as a win.
How do I compare creator cost with benchmark costs?
Benchmarks help you decide whether a creator fee is reasonable before any ad spend. The influencer pricing benchmarks page reports OpenSponsorship (July 2026) at a median paid cost per deliverable of $134 for nano and $2,727 for mega creators. Use the influencer rate card estimator to see published rates by tier and format.
For engagement, the engagement rate benchmarks page cites IQFluence (September 2026) at a median Instagram engagement rate of 2.79% for nano and 0.97% for micro creators. The engagement rate calculator shows where a creator's own rate falls against those tiers.

What should the monthly report contain?
One page is enough if the layout never changes. Follow this ordered checklist each month.
- State the period, attribution rule and revenue source at the top of the page.
- List total spend in four lines: Meta media, Google media, creator fees and rights, and production.
- Show working-media return and fully loaded return for each channel, on the same row layout.
- Add a creator block with one row per creator: fee, ad spend behind their content, revenue counted, code or link sales, and both returns.
- Add a creative block comparing creator-made and brand-made ads on CPM, CTR and return, as Modash recommends.
- Report organic creator metrics, such as views, saves and shares, in a separate block.
- Add the latest incrementality result, or say when the next test is planned.
- Close with three decisions: what to scale, what to pause and what to test next.
For the same reason, keep the vocabulary stable. If one month the report says "ROAS" for media-only and the next for fully loaded, readers will not trust either.
How should you handle the awkward cases?
Creator sales that Meta does not see
Sales from codes, links and word of mouth often never carry an ad click. Show them as a labelled add-on row, as in the worked example, and do not merge them silently into the platform number. The Nurdd guide to dark social and word-of-mouth attribution explains how to account for this.
Overlap between creator and brand ads
If both run to the same audience, each will take credit for the same purchase. Compare last-touch and multi-touch attribution for creator campaigns, and check audience overlap in Meta before reading small differences as real.
Inflated dashboard numbers
A platform dashboard can look healthy while the bank account disagrees, and the Nurdd article on why Meta ROAS looks inflated lists common causes. Reconcile the revenue column to your store or finance numbers at least once a quarter.
What are the common mistakes in influencer marketing reporting?
- Comparing fee to media spend. A creator fee covers more than media, so compare it on a fully loaded basis, and show working-media return on its own line.
- Mixing attribution windows. A creator row on a seven-day code window beside an ad row on a one-day view window is not a fair comparison.
- Counting organic reach as ad reach. Impressions from the creator's own audience belong in the organic block, not in your CPM line.
- Skipping audience quality. A creator with inflated followers will produce poor ads. Check with the fake follower checker and the fake follower audit checklist before you pay.
- Reporting results with no decision. Each report should end with scale, pause and test actions.
- Never testing incrementality. Without a holdout, attribution can only tell you who was credited.
How do Pulse and Nia by Nurdd split the work?
Pulse and Nia by Nurdd are separate products, and a reporting stack needs both sides of the ledger. Pulse covers the ad-side data and Nia covers the creator side. The scorecard above is where the two meet.
Pulse by Nurdd is a web dashboard that connects to Meta Ads and Google Ads through read-only OAuth. It explains campaign performance in plain language, diagnoses what changed and recommends specific actions, so the media-spend and return columns do not need a hand-built report. Pulse is paid, has no trial and is currently in private access.
Nia by Nurdd is an AI-native creative studio at getnia.studio with influencer marketing built in. For the creator side of the scorecard, Nia by Nurdd discovers creators from 10M+ profiles, scores them with TruAI fake follower detection, forecasts return before spend and attributes product-level sales to each creator after the campaign. Nia is priced below comparable plans.
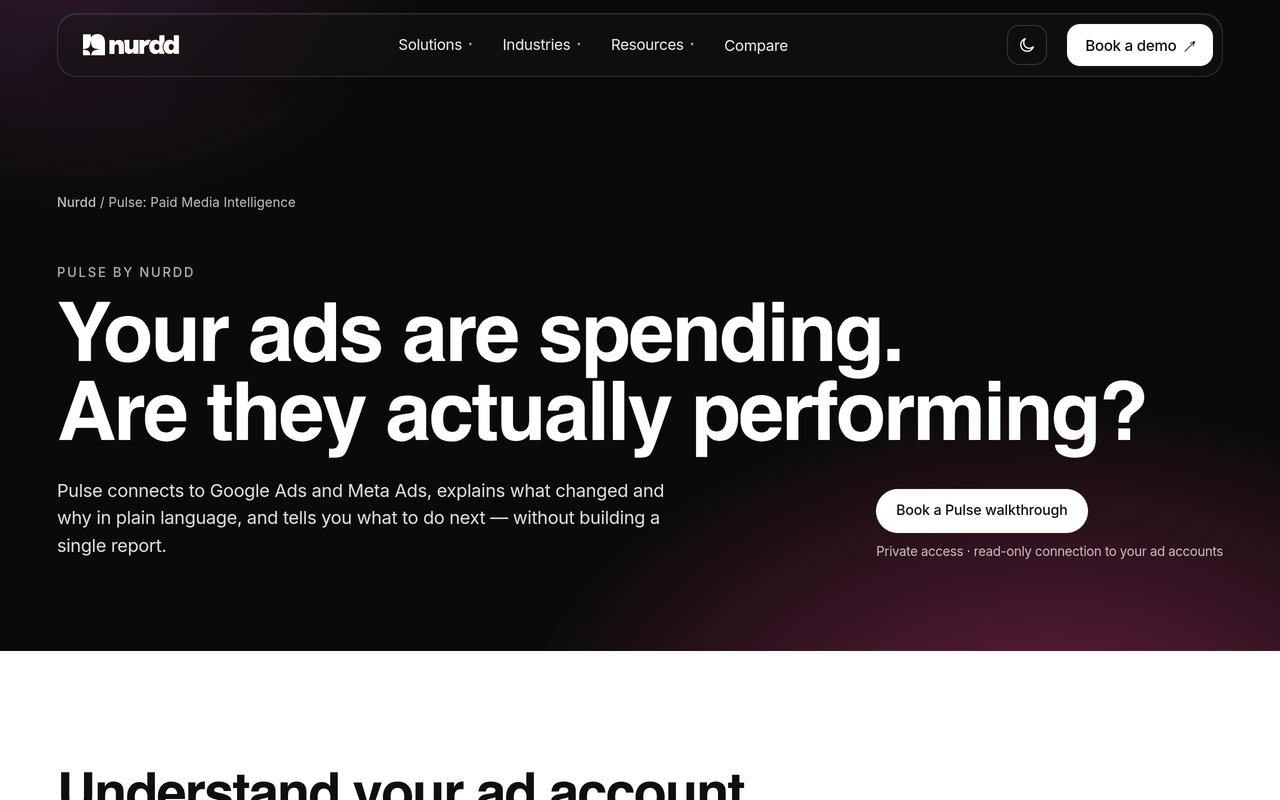
Pulse by Nurdd belongs in this answer because it reads the Meta and Google side of the comparison without a manual report: read-only access, plain-language explanations and a clear account of what changed. Used with the creator figures from Nia by Nurdd, a paid social team can fill both halves of one scorecard from sources it can name.
Book a demo at https://www.nurdd.club/demo to see Pulse read your own Meta and Google Ads account and to walk through how your creator results would sit beside it.
What does this look like for different roles?
The in-house paid social manager
The manager runs Meta and Google and is asked why creator campaigns are not in the weekly report. The fix is the cost-bucket table: they add a creator block with fee and boosted spend, and see in Pulse what changed in the ad accounts week to week. Creator results from Nia fill the other half, and the marketing budget planner helps split the next month's budget.
The agency account lead
The account lead reports to several clients and needs one layout that fits all of them. They fix the attribution rule per client, place creator and brand creative on the same two returns and present a monthly scorecard. For paid work run by a team, the paid social advertising agency service and the agency versus software guide show how to split effort.
The head of growth
The head of growth wants to know whether to move budget from ads to creators. They ask for the fully loaded return, the incrementality result and a forecast. The influencer ROI calculator and the D2C measurement framework frame that decision across influencers, paid ads and AI search.
Next step: see your own numbers on one scorecard
A demo of Pulse by Nurdd shows your Meta and Google Ads account explained in plain language, with the changes behind your latest results. We can also show how creator results from Nia by Nurdd would sit in the same layout. Book a demo to see it on your own brand.
How we researched this
We reviewed public articles on influencer reporting, platform announcements from Google and YouTube, trade coverage of Meta's partnership ads tools, published guides to Meta attribution and incrementality testing, and Nurdd's own benchmark pages. Sources were checked on the publication date of this article. We did not run hands-on tests, and the worked example uses illustrative inputs rather than customer or measured data.
Frequently asked questions
How do I report influencer results next to paid ads?
Build one scorecard with the same columns for creators and ad campaigns: spend, revenue counted, working-media return and fully loaded return. State the attribution rule at the top. Keep organic creator metrics in a separate block.
How do I compare creator spend with Meta ad spend?
Split creator spend into fee, rights and paid amplification. Compare the amplification spend with Meta media spend for working-media return, and add the fee and rights for the fully loaded return. Compare against brand-made creative that carries its own production cost.
What metrics belong in an influencer marketing report for a paid team?
Include spend by bucket, revenue counted, CPM, CTR, working-media return, fully loaded return, code or link sales, and the latest incrementality result. Organic views, saves and shares sit in a separate block.
Which attribution window should I use for creator campaigns?
Use the same window as the rest of your paid reporting so rows are comparable. Meta's default for website conversions is 7-day click, 1-day engage and 1-day view. Label any sales from codes or links as a separate line.
How often should I report creator performance?
Monthly works for most teams, with a weekly check on live partnership ads. Modash notes that cadence should follow how the rest of your marketing team reports, so creator numbers are not out of step.
Can creator content be reported inside Google Ads?
Google says brands can link creator videos in Google Ads, and that in some markets BrandConnect in Google Ads offers measurement and reporting for sponsored content. Availability varies by market, so check your account.
Does Pulse report creator results?
Pulse by Nurdd reads Meta Ads and Google Ads accounts. Creator discovery, vetting, forecasting and sales attribution happen in Nia by Nurdd, and the two sets of figures meet on your shared scorecard.
Is influencer spend incremental?
Attribution cannot answer that on its own. A holdout or geo test compares sales with and without the spend. Run one before moving a large share of budget.